Boring Money data reveals how investors can save a fortune
22nd January 2019 11:13
by Jemma Jackson from interactive investor
Difference between highest and lowest-cost trading platforms over 30 years exceeds the average UK salary.
The financial services sector loves to talk about the power of compounding on investment returns over the long-term, but tends to skip over the impact that compounding of charges can have as time marches on.
Research by Boring Money on behalf of interactive investor found that over the long-term (30 years), platform charges are costing many Britons tens of thousands of pounds.
On the average stocks and shares ISA balance (£51,306, according to HMRC), the impact of charges over 30 years means that customers of the lowest-cost platforms would be £33,000 better off compared to the highest-cost platforms.
This is more than the average annual income in the UK of just under £30,000, and is enough money to:
- Help a child or grandchild with the average deposit on a first home, (£33,127, according to Halifax)
- Fund the average UK wedding (£30,355 according to Bridebook.co.uk)
- Pay for a year in residential care home (£32,344 per year on average in the UK, according to Paying for Care).
- Buy one of the best SUV cars on the market
Boring Money looked at a range of scenarios (see tables and methodology in notes at end of the article). It found that interactive investor and Halifax Share Dealing consistently provide the best outcome for investors with larger pots (over £50,000).
Richard Wilson, Chief Executive, interactive investor says: "The platform industry has a dogged obsession with percentage fees, and this research lifts the lid on why. Essentially, the more money a customer has in their pot, the more they will tend to pay in charges.
"Our flat-fee structure has always challenged the industry norm. We know that bigger pots do not bring a higher workload or increased costs for platforms and suggesting otherwise is a nonsense. That’s not to say we don’t have work to do. Our flat-fee will naturally be more cost-effective for customers with bigger pots of £50,000 or more, and one of our current aims is to see how we can also be more competitive for investors with smaller pots.
"Ultimately, a flat fee means that consumers know exactly what they are paying in platform fees. Obscure platform charges serve only to reinforce the feeling that somewhere in the chain we are being ripped off."
Holly MacKay, CEO, Boring Money, says: "Competition in the DIY investing market is not working as well as it should. I've been working with investment platforms for 20 years now and I struggle to work out what I would pay on many platforms who have complex structures with multiple parts. Trying to compare like with like is unacceptably complex.
"It's also true that most cost comparisons only look at a single year period. If we look at the impact of charges over a much longer timeframe we can see that the decision of where to invest can make a significant impact on the end value of someone's life savings.
"Good service costs money to provide and different people have different requirements and price points. But customers cannot make a meaningful assessment of value without first understanding the total costs involved and the impact this has over the lifetime of the investment. We need to do much more to help investors truly understand the cost of the services we are providing."
Boring Money factored in 5% annual growth after charges and assumed a 50/50 split between funds and shares. Costs were calculated over a 30-year period.
The average stocks and shares ISA
For the average stocks and shares ISA, which is £51,306, according to HMRC, a customer would have an extra £33k in their ISA after 30 years if they were with the most cost-effective platforms versus the most expensive platforms.
That's enough to cover the average deposit on a first property, according to research from Halifax. It is also more than the average UK salary of just under £30,000, would fund the average UK wedding and pay for one of the best SUV cars on the market.
Boring Money assumed a balance of £51,306, no additional contributions, and six trades a year for rebalancing purposes, which represents the average number of trades per year for stocks and shares ISA customers of interactive investor.
Average stocks and shares ISA with frequent trades
Boring Money then took their research a step further. They looked at the average stocks and shares ISA (£51,306) and then added in an annual contribution of £10,124 over 30 years, this being the average Stocks and Shares ISA subscription in the 2017/18 tax year, according to HMRC. They assumed one-twelfth of this lump sum would be invested monthly into one fund and one share (24 trades per year).
In this instance, the impact of charges over 30 years was greater still. A customer in the lowest cost platforms would have £52,000 more in their ISA at the end of this period. This would cover the average student debt - £50,000, according to the Institute for Fiscal Studies.
Notes:
The research in detail - average stocks and shares ISA
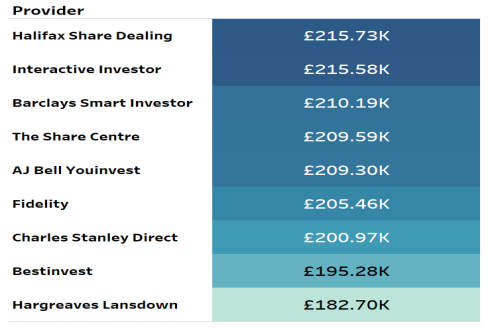
- Stocks and Shares ISA with an initial balance of £51,306, which corresponds to the average Stocks and Shares ISA market value according to HMRC.
- No additional contributions.
- Six trades per year for rebalancing, which represents the average number of trades per year for Stocks and Shares ISA customers of interactive investor.
Total Investment Value after 30 Years by Provider
Average stocks and shares ISA with frequent trades
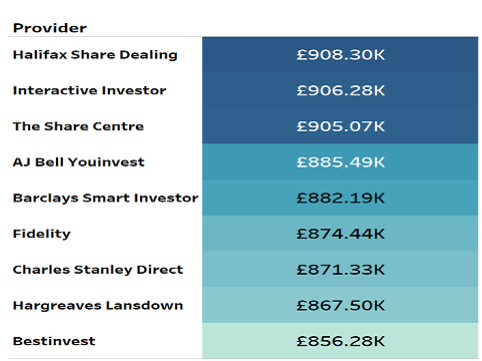
- Stocks and Shares ISA with an initial balance of £51,306, which corresponds to the average Stocks and Shares ISA market value according to HMRC.
- Annual contributions of £10,124, which corresponds to the average Stocks and Shares ISA subscription in the tax year 2017-18 according to HMRC.
- The annual contribution is applied monthly, assuming the investor regular invests into one fund and one share. Therefore, giving a total of 24 trades per year.
Total Investment Value after 30 Years by Provider
Methodology and notes
General
- Assumed a 5% annual return in the portfolio after investment charges, with the return applied monthly
- Costs were calculated over a 30-year period
- Contributions were assumed to be wholly invested on the first day of the month, with additional funds used to cover costs, this is represented by the net investment value after the end of the 30-year period
- Trades were assumed to be conducted on the first day of the month
- Costs for percentage-based platform fees were calculated on the value of the portfolio at the end of the previous month, after returns had been applied
- Trades were spread out across the year, where less than 12 trades per year occurred, they were spread out across each quarter, and rounded to the nearest whole number. Therefore, in some months there will be no trades. I.e. when 6 trades per year occurred, this was split into 1 fund trade and 1 share trade in Q1, 1 fund trade in Q2, 1 fund trade and 1 share trade in Q3, and 1 share trade in Q4. In Q1 there was 1 fund trade in month 1, 1 share trade in month 2 and no trades in month 3
- Where multiple trading options exist, i.e. The Share Centre, the most cost-effective option was used in each scenario
- Costs did not include any initial set-up fees or temporary offers, such as a lower charge in an initial period of being a customer or discounts because of transfers
- Where yearly/quarterly maximum fees existed, i.e. for holding shares – if the charge per year/quarter exceeded the yearly/quarterly maximum fee, then the maximum fee was spread out across the year and applied monthly.
These articles are provided for information purposes only. Occasionally, an opinion about whether to buy or sell a specific investment may be provided by third parties. The content is not intended to be a personal recommendation to buy or sell any financial instrument or product, or to adopt any investment strategy as it is not provided based on an assessment of your investing knowledge and experience, your financial situation or your investment objectives. The value of your investments, and the income derived from them, may go down as well as up. You may not get back all the money that you invest. The investments referred to in this article may not be suitable for all investors, and if in doubt, an investor should seek advice from a qualified investment adviser.
Full performance can be found on the company or index summary page on the interactive investor website. Simply click on the company's or index name highlighted in the article.