Can history predict US election result?
2nd November 2016 11:51
by Lance Roberts from ii contributor
As the US presidential election draws near, it is worth considering how the market has historically performed during the month of November and specifically during election years.
First, if we look at the month of November going back to 1960, we find that there is a bias for the month to end positively 61% of the time.
In other words, three out of every five months finished in positive territory which is why it is included in the seasonally strong period of the entire year. Furthermore, the average and median returns for the month top 1% over the course of that time.
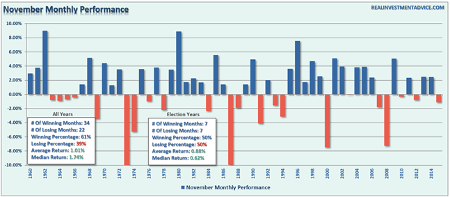
However, when we look at just the November months which coincided with people going to the polls to cast their vote, we find an even split of wins and losses. Even though the number of months is evenly split between gains and losses, the average and median returns were still positive over the given time frame.
Unfortunately, average and median returns aren't representative of the capital destruction that has taken place historically such as the massive draw down during the 2008 election. The chart below shows the history of actual market returns by day for every month of November going back to 1960. Importantly, in order for the market to have an average return of 1.01%, it means there has been a variability of returns both above and below that average.
A look at daily price movements during the month, on average, reveal the fifth through the eighth trading days of the month are the weakest followed by mid-month.
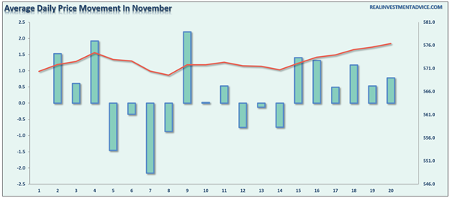
However, during election years, we see the same periods remaining weak, but more dramatically so as the volatility of election years skews the average of all years. In other words, regardless of who is elected on the eighth, look for a relief rally on the ninth, followed by a sell-off over the next few days.
The traditional post-Thanksgiving rally tends to be stronger performance wise as the "inmates run the asylum" during exceptionally light volume trading days.

Jason Goepfert via Sentimentrader.com did some similar analysis as well recently but took it down to the sector specific level which is helpful in determining what sectors to over/underweight heading into the end of the year.
"We show the same data for each of the 10 major S&P 500 sectors on the next page (REITs aren't yet included). Again, it's hard to discern any actionable pattern among the sectors. There was some general weakness in tech ahead of the election, but the group had strong returns in the weeks following, excepting a few large outliers. Financials also did well after the elections, and the returns were more tightly grouped on the upside. Consumer discretionary stocks were the most consistent laggards."
This article is for information and discussion purposes only and does not form a recommendation to invest or otherwise. The value of an investment may fall. The investments referred to in this article may not be suitable for all investors, and if in doubt, an investor should seek advice from a qualified investment adviser.
Lance Roberts is a Chief Portfolio Strategist/Economist for Clarity Financial. He is also the host of "The Lance Roberts Show" and Chief Editor of the "Real Investment Advice" website and author of The "Real Investment Daily" blog and the "Real Investment Report". Follow Lance on Facebook, Twitter and Linked-In.