Can M&S shares continue impressive rally?
Shares in the food and clothes chain are up 76% in the past year at prices not seen since 2018. Independent analyst Alistair Strang consults his charts for signs that this turnaround has further to run.
23rd May 2024 07:40
by Alistair Strang from Trends and Targets
At first glance yesterday, when the share price soared following well-received annual results, it was easy to assume happy days were ahead for Marks & Spencer Group (LSE:MKS), aside from a small but perhaps crucial detail.
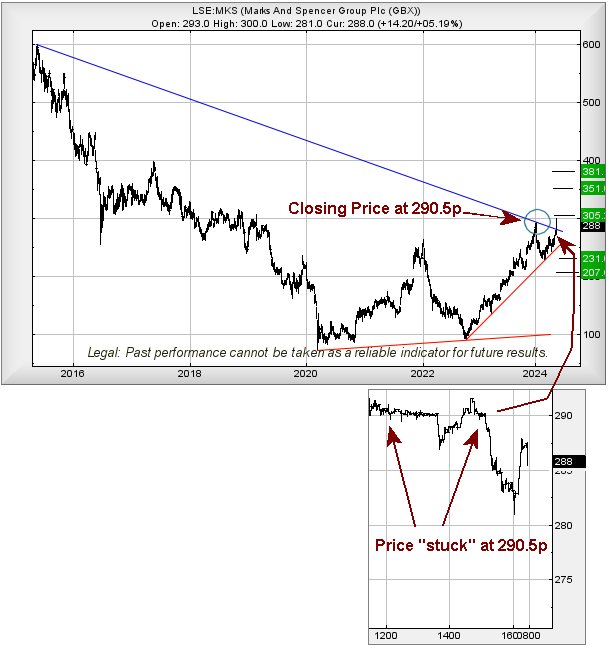
We often reiterate our demand that a share price actually closes at or above a specific level to give an accurate clue as to what the future holds. The circled area on the chart below highlights our issue, as M&S closed at 290.5p at that point.
Now, despite breaking above the downtrend, it noticeably failed to close above this prior high, ending the session at 288p. As a result, we’re not confident with the immediate projections as this sort of thing is rarely a mistake by trading software.
- Invest with ii: Open a Stocks & Shares ISA | ISA Investment Ideas | Transfer a Stocks & Shares ISA
If we go by the trading range on Wednesday, apparently above 300p should next propel M&S to 305p with our longer-term secondary calculating at 351p. If it were not for the important detail the share failed to close the session above the prior high, we’d be very confident with these projections, especially as our own software is supplying a cluster of different calculations, all of which should end up at 381p eventually, along with some hesitation.
When a share price has multiple separate criteria all pointing to the same price levels, we’ve learned to resign ourselves to the future but, in this instance, the failure to better a prior high bothers us.
Highlighting the issue, the minute-by-minute chart extract for the 21 May shows the M&S share price was “stuck” at the level of the prior high, 290.5p, until 3pm, when the market decided to let it drop. It was all really strange, hence our caution.
In the event of the share price now trading below 277p, our concerns risk becoming a reality as this risks triggering reversals down to 231p initially with secondary, if broken, at 207p. Visually, we would anticipate the 231p level as being capable of provoking a decent bounce.
Source: Trends and Targets. Past performance is not a guide to future performance.
Alistair Strang has led high-profile and "top secret" software projects since the late 1970s and won the original John Logie Baird Award for inventors and innovators. After the financial crash, he wanted to know "how it worked" with a view to mimicking existing trading formulas and predicting what was coming next. His results speak for themselves as he continually refines the methodology.
Alistair Strang is a freelance contributor and not a direct employee of Interactive Investor. All correspondence is with Alistair Strang, who for these purposes is deemed a third-party supplier. Buying, selling and investing in shares is not without risk. Market and company movement will affect your performance and you may get back less than you invest. Neither Alistair Strang or Interactive Investor will be responsible for any losses that may be incurred as a result of following a trading idea.
These articles are provided for information purposes only. Occasionally, an opinion about whether to buy or sell a specific investment may be provided by third parties. The content is not intended to be a personal recommendation to buy or sell any financial instrument or product, or to adopt any investment strategy as it is not provided based on an assessment of your investing knowledge and experience, your financial situation or your investment objectives. The value of your investments, and the income derived from them, may go down as well as up. You may not get back all the money that you invest. The investments referred to in this article may not be suitable for all investors, and if in doubt, an investor should seek advice from a qualified investment adviser.
Full performance can be found on the company or index summary page on the interactive investor website. Simply click on the company's or index name highlighted in the article.