The case for small-caps in four charts
Andrew Paisley looks at four of the key reasons to consider the asset class in today’s uncertain climate.
23rd November 2023 14:16
by Andrew Paisley from Aberdeen

With a few exceptions, economic indicators around the world are showing signs of slowing. This creates a challenging backdrop for smaller companies. However, we believe there are compelling reasons to consider the asset class, even in today’s uncertain climate. We make our case in four charts.
Attractive valuations versus large caps
Our starting point is valuations. As Chart 1 shows, European smaller companies are trading at historic lows relative to large caps. This factor is mirrored in the UK and globally. We think this means they offer an attractive entry point for investors. We show why in our next two charts.
Chart 1: European small versus European large valuations
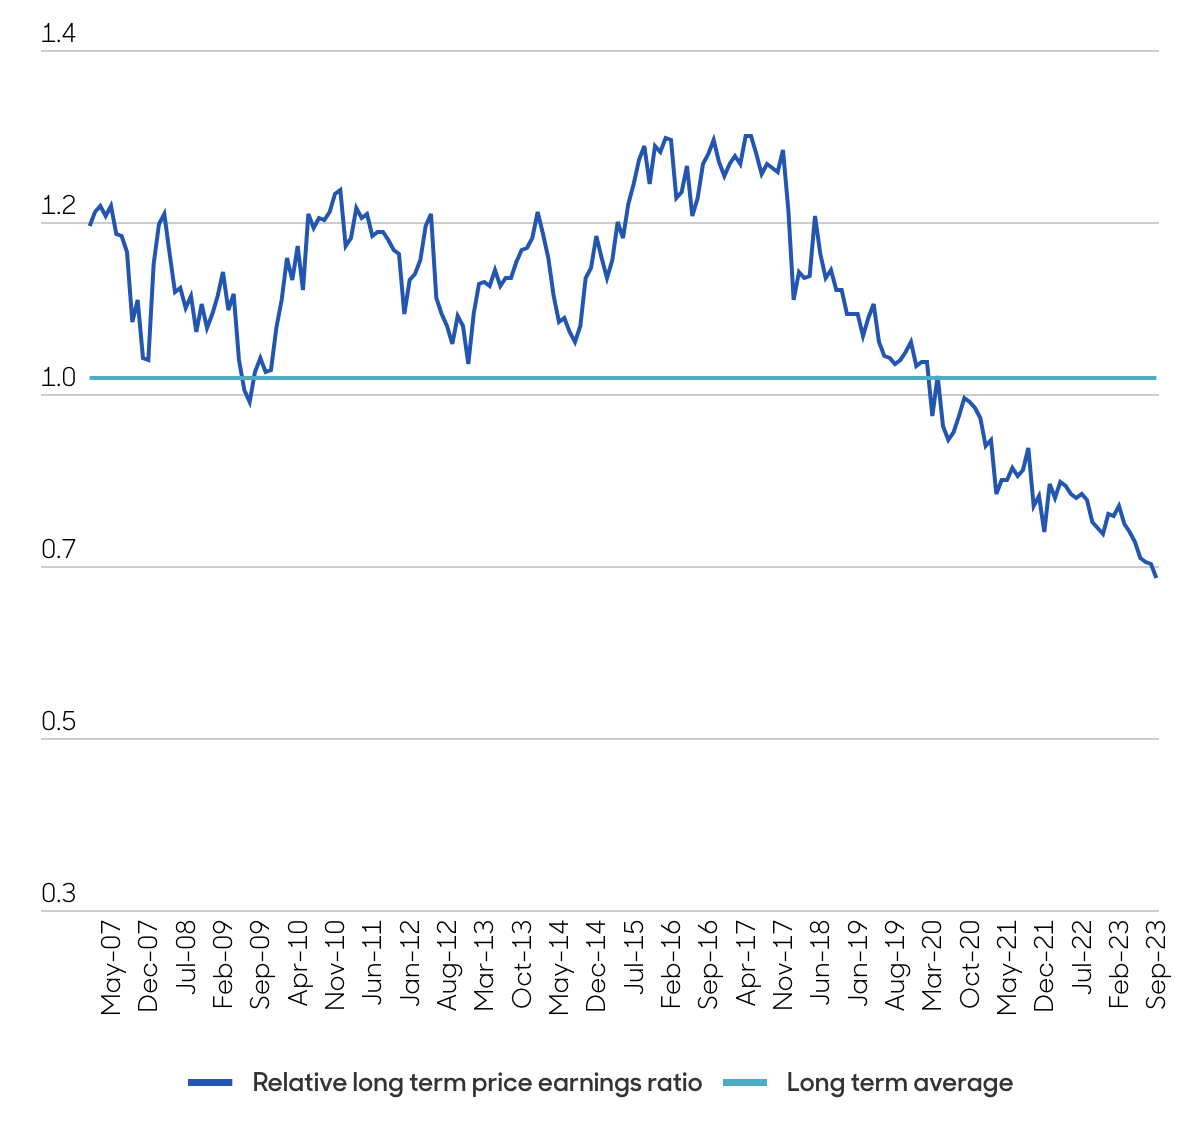
Source: Bloomberg (data is long term price earnings ratio), For illustrative purposes only. No assumptions regarding future performance should be made, 31 January 2008 to 30 September 2023. valuation of MSCI Europe ex UK Small Cap vs MSCI Europe ex UK.
Smaller companies and recession – not what you might think
Most investors think smaller companies underperform in a recession. In most cases, they are correct. However, what’s less well-known is that small caps usually exit recessions quicker than assumed – outperforming large caps. This rebound can begin as early as three months into an economic downturn. Chart 2, shows the relative average performance of US small caps versus large caps before, during and after recessions (dating back to the 1980s).
This bounce back occurs because market participants tend to price in an economic recovery before it happens. Yet this trend is not part of the traditional small/large-cap narrative. We believe this disconnect creates opportunities for active investors. Source: Bloomberg (data is long term price earnings ratio), For illustrative purposes only. No assumptions regarding future performance should be made, 31 January 2008 to 31 March 2023. Valuation of MSCI Europe ex UK Small Cap versus MSCI Europe ex UK.
Chart 2: Relative Performance of Russell 2000 versus S&P 500 Index Around Recessions
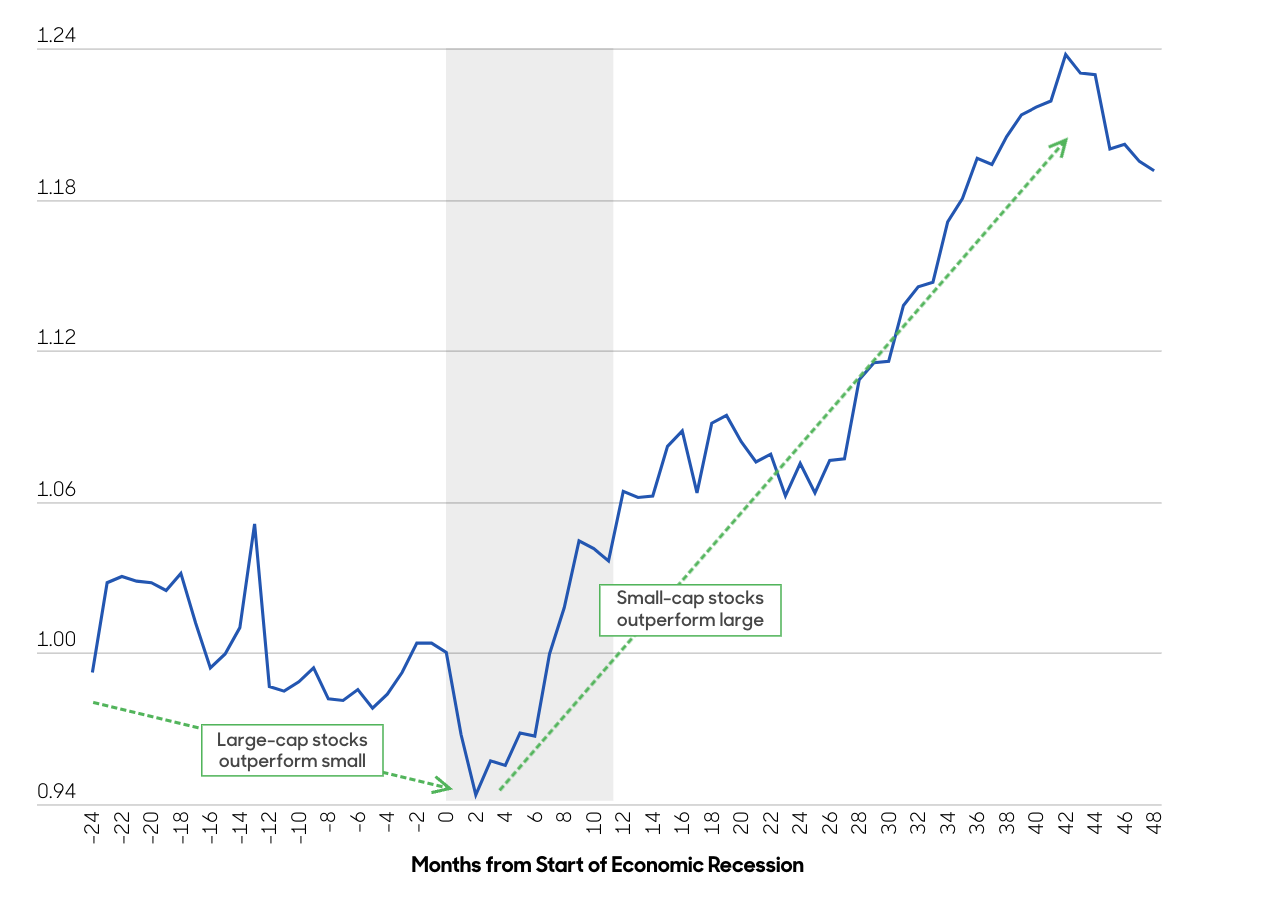
Source: Bloomberg, For Illustrative Purposes Only, William Blair Equity Research, October 2022
Smaller companies lead the market higher?
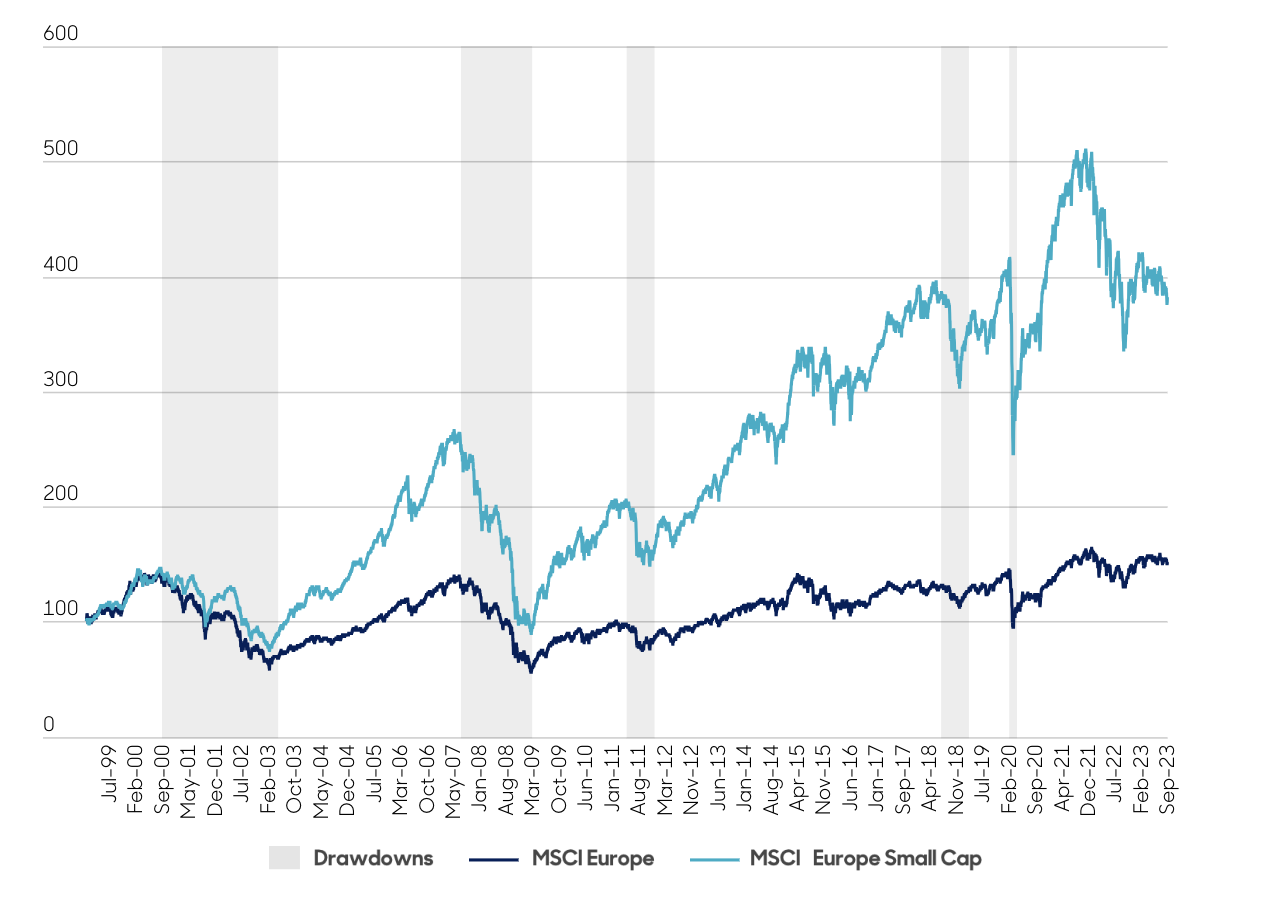
Building on Chart 2, evidence shows that smaller companies recover quicker than large caps after drawdown periods. Small caps are nimbler and able to react faster than large caps to changes in the business environment. They can take advantage of the new opportunities a growing economy offers. The consequent rise in investor risk appetite also helps smaller companies. Again, the chart pertains to Europe, but we have witnessed this phenomenon across geographies.
Chart 3: Smaller companies lead the market higher?
| Large Cap | ||||
|---|---|---|---|---|
| Start Date | End Date | Large Cap Drawdown | Recovery Date | Time To Recover (m) |
| Sep-00 | Mar-03 | -49.30% | Dec-19 | 202 |
| Jul-07 | Mar-09 | -66.50% | Apr-15 | 73 |
| May-11 | Nov-11 | -27.60% | Jan-13 | 13 |
| Jun-18 | Dec-18 | -23.80% | May-19 | 4 |
| Feb-20 | Mar-20 | -41.40% | May-21 | 14 |
| Small Cap | ||||
|---|---|---|---|---|
| Start Date | End Date | Small Cap Drawdown | Recovery Date | Time To Recover (m) |
| Sep-00 | Mar-03 | -59.00% | Jan-05 | 23 |
| Jul-07 | Mar-09 | -60.40% | Jan-14 | 58 |
| May-11 | Nov-11 | -21.70% | Jan-13 | 14 |
| Jun-18 | Dec-18 | -15.80% | Dec-19 | 12 |
| Feb-20 | Mar-20 | -35.40% | Jan-21 | 10 |
Source: Refinitiv Eikon, in EUR, 01 January 1999 to 31 March 2023.
A focus on quality growth firms
Of course, not all smaller companies are equal. In the current environment, we favour quality growth companies. During periods of stress, investors usually favour businesses with robust profitability, good cashflow, strong management, and sound ESG (environmental, social and governance) standards. High barriers to entry, unique growth drivers and pricing power are also attractive characteristics. By contrast, businesses with elevated debt levels or that rely on external factors to succeed could fall by the wayside.
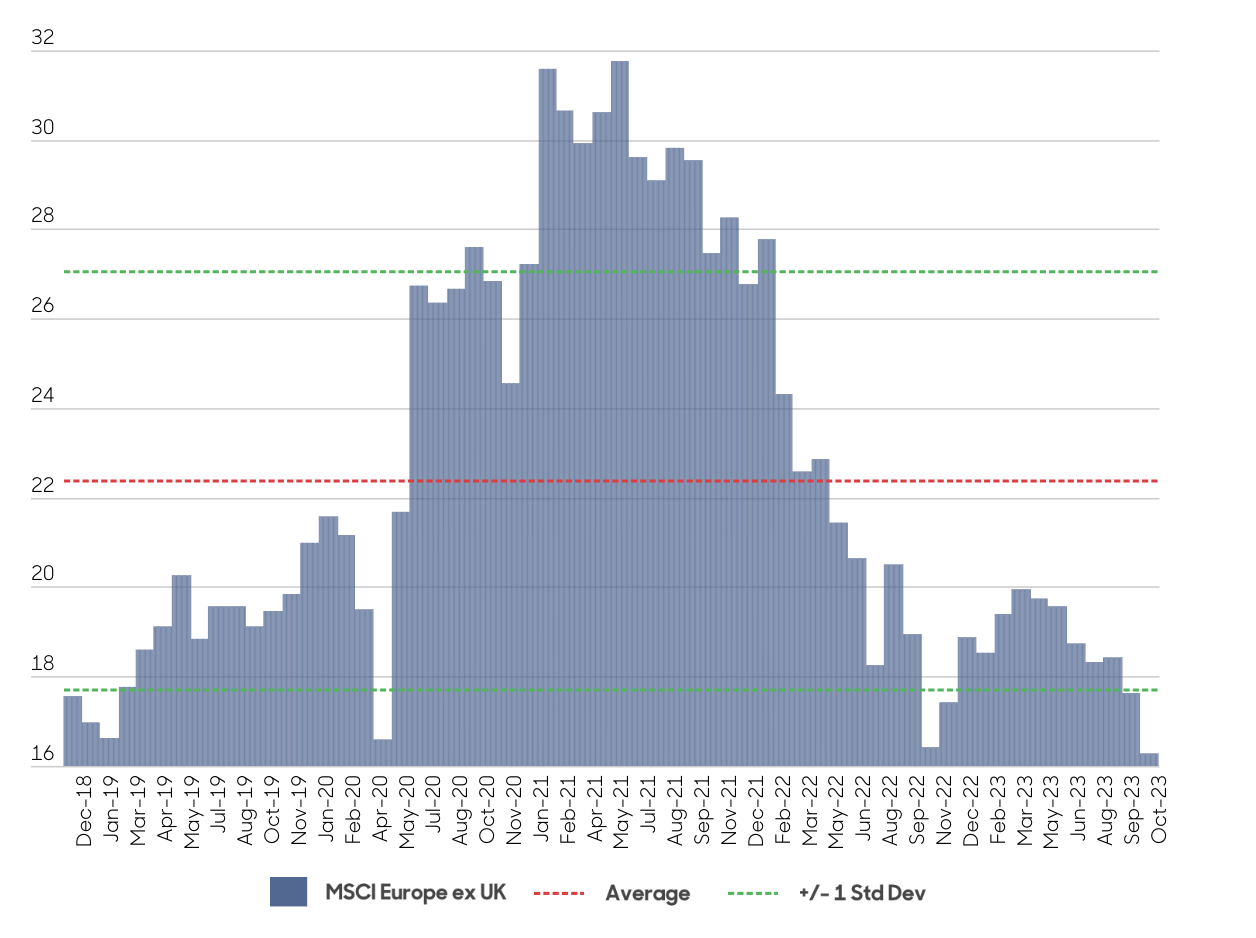
Importantly, as we see from Chart 4, quality growth stock valuations are no longer stretched, offering potential upside from here. This compares favourably with US bond yields and value stocks – both of which are close to levels seen during previous market highs.
Chart 4: Growth valuations no longer look stretched (MSCI Europe ex UK)
Growth valuations no longer look stretched (MSCI UK)

abrdn, Refinitiv Datastream, MSCI, 31 March 2023.
The current outlook is challenging. Given this, many risk-averse investors might avoid smaller companies. However, we believe there are compelling reasons to reconsider. History shows that small caps rebound in recession earlier than thought. They also tend to bounce back stronger than large caps. With valuations historically attractive, we believe now is a good time to snap up high-quality companies ahead of any recovery.
Andrew Paisley is head of smaller companies, abrdn.
ii is an abrdn business.
abrdn is a global investment company that helps customers plan, save and invest for their future.
These articles are provided for information purposes only. Occasionally, an opinion about whether to buy or sell a specific investment may be provided by third parties. The content is not intended to be a personal recommendation to buy or sell any financial instrument or product, or to adopt any investment strategy as it is not provided based on an assessment of your investing knowledge and experience, your financial situation or your investment objectives. The value of your investments, and the income derived from them, may go down as well as up. You may not get back all the money that you invest. The investments referred to in this article may not be suitable for all investors, and if in doubt, an investor should seek advice from a qualified investment adviser.
Full performance can be found on the company or index summary page on the interactive investor website. Simply click on the company's or index name highlighted in the article.