Is Centamin back on track after share price surge?
Our financial markets expert explains the popularity of oil and why miner Centamin is back in favour.
24th April 2019 11:57
by Rajan Dhall from interactive investor
Our financial markets expert explains the popularity of oil and why miner Centamin is back in favour.
Oil prices – both West Texas Intermediate (WTI) and Brent crude - are trading at multi-month highs currently as yet another geopolitical event affects the supply/demand outlook.
US president Donald Trump is at it again, this time probably not in the way he would like. On Monday, Trump announced that once the current round of Iran sanctions come to an end he could sanction the countries buying oil from them. The countries include Saudi Arabia, UAE, Japan, India and China.
The Trump administration says it has secured assurances from Saudi Arabia and the UAE that they would cover the gap created by lost crude from Iran. But some analysts believe India and China may ignore Trump's threats and continue buying oil from Iran.
However, with US-China trade talks ongoing, it may not be wise to rock the boat when it comes to the US. China must, therefore, find another source for the 500,000 barrels per day it imports from Iran.
From a technical viewpoint, the oil price burst through strong resistance at $64.37 per barrel. This area could now be a key support in the future as it was previously between May and September 2018.
The price is now heading into a very congested area where a large consolidation took place during May and October (see chart below). Lots of action was noted around $59.50 per barrel and within this congestion area where most contracts changed hands.
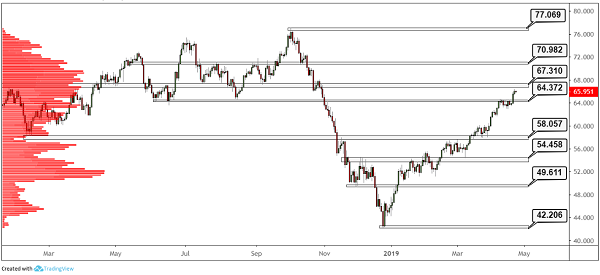
Source: TradingView Past performance is not a guide to future performance
Centamin - Good as gold
Centamin (LSE:CEY) this morning released its latest production and exploration update for the first quarter. Its share price jumped as much as 7.5% as the miner reported gold production of 116,183 ounces (oz) for the quarter ending 31 March. That exceeded its guidance range of 105-115,000oz in what the company expects to be the slowest production quarter this year.
The good news doesn't stop there. The company says, "Both unit cash costs and all in sustaining costs are trending toward the lower end of annual guidance".
Broker Peel Hunt also noted this, with its analysts saying this was “driven by lower cash costs (mainly on a cost savings drive which started in 1Q19) as well as lower sustaining capex during the quarter. Most important is that cash and liquid assets progressed during the quarter to $332 million vs $322 million at year end".
The future also looks bright as Panmure Gordan Analyst Kieron Hodgson noted:
"Whilst the company reiterated its annual guidance for gold production of 490-520koz at cash costs of $675-725/oz and an AISC [all in sustaining cost] of $890-950/oz, we are encouraged by the intention to publish a three-year forward guidance outlook in Q2".
Hodgson added: "Given the strong balance sheet ($331.6 million net cash as at 31 March), we see the potential for highly accretive developments in the Western African portfolio, most notably the Doropo project and the completion of the solar power plant feasibility study".
Overall, this report is in stark contrast to the one on the 25 February where the company's share price fell 28% following the $70 million or so drop in full-year revenue compared to the previous year's report.
It seems the company may be back on track and, looking at the chart below, I would be inclined to agree if the 92.66p area is broken.
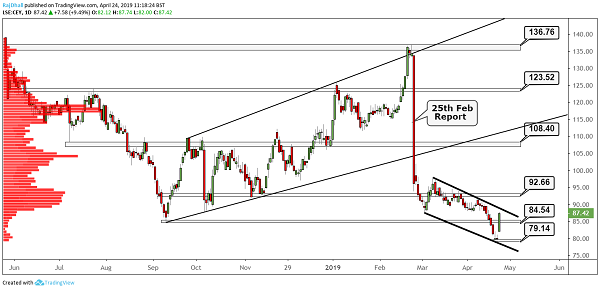
Source: TradingView Past performance is not a guide to future performance
The February 95p low is also a symbolic resistance level as the market would indicate that we are back in the range from the disappointing report.
Another bullish signal would be the break of the parallel pattern at the bottom right of the chart. The top of the pattern may be used as support if broken so keep an eye on price action there.
These articles are provided for information purposes only. Occasionally, an opinion about whether to buy or sell a specific investment may be provided by third parties. The content is not intended to be a personal recommendation to buy or sell any financial instrument or product, or to adopt any investment strategy as it is not provided based on an assessment of your investing knowledge and experience, your financial situation or your investment objectives. The value of your investments, and the income derived from them, may go down as well as up. You may not get back all the money that you invest. The investments referred to in this article may not be suitable for all investors, and if in doubt, an investor should seek advice from a qualified investment adviser.
Full performance can be found on the company or index summary page on the interactive investor website. Simply click on the company's or index name highlighted in the article.