Chart of the week: are investors right to fear rising bond yields?
Risk is being taken off asset markets – raising the question of where that leaves the FTSE.
1st March 2021 13:29
by John Burford from interactive investor
Risk is being taken off asset markets – raising the question of where that leaves the FTSE.

Mayhem broke out in markets last week. The mainstream media is now abuzz with the culprit being rising bond yields and the bursting of the bond bubble. What took them so long to notice?
I have been tracking US Treasury bond prices and yields for some time. I knew there was a case to be made for the great multi-decade speculative bubbles to burst once investors/traders got wind that interest rates might not ‘stay lower for longer’ after all.
Maybe ‘free money’ has a limited life span after all! And last week, the penny dropped that bond yields were already surging in response to the hot commodity markets. A reality check suddenly arrived.
Yes, commodities including copper, crude oil and lumber (all sensitive to general economic expectations) have been booming. The charts were there for all to see and a simple glance at them provided an obvious clue that all might not be well with the market. That is despite universal claims that the rapid global vaccine roll-outs would soon lead to business-as-usual later this year with booming profits and US GBP growth of 6% and higher.
- Market snapshot: bonds, oil, inflation and the Budget
- Don’t be shy, ask ii...why do some bond funds have such high yields?
- Market snapshot: IAG shares and bond yields both head higher
Already, my two favourite poster children for highlighting the mania for assets are falling off their perch:
- Tesla (NASDAQ:TSLA) is down 25% off its $900 (£644.72) all-time high, (ATH) set on 25 January, validating my immediate bearish stance in last week’s column where I advised taking profits.
- Bitcoin is also down 25% off its $58,370 ATH, set 21 February.
So with bond yields advancing, risk is rapidly being taken off asset markets. Even that supposed ‘safe haven’, gold, is in free-fall. So much for that theory.
So where does that leave the FTSE? In recent posts, I have been bearish and events since have not convinced me I was wrong. Here is the latest chart:
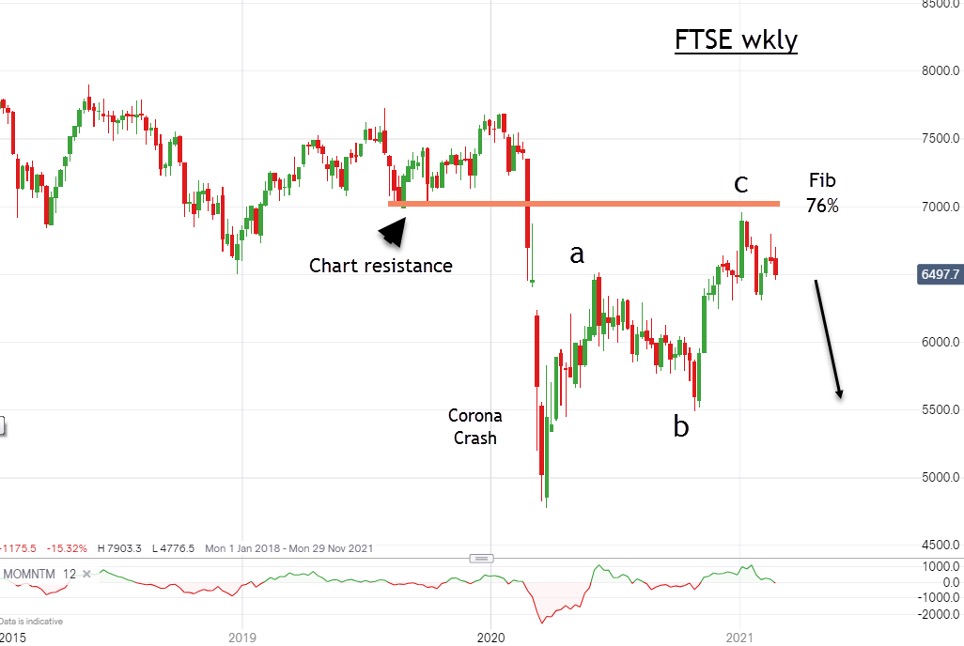
Source: interactive investor. Past performance is not a guide to future performance.
The key feature is the rally off the 2020 coronavirus crash, in the form of a three up to the conjunction of the Fibonacci 76% retrace and the chart resistance.
That is a very powerful resistance level, and my belief is that any advance now is unlikely to breach that 6,950 point.
I remain bearish on the FTSE in the medium to long term.
John Burford is the author of the definitive text on his trading method, Tramline Trading. He is also a freelance contributor and not a direct employee of interactive investor.
These articles are provided for information purposes only. Occasionally, an opinion about whether to buy or sell a specific investment may be provided by third parties. The content is not intended to be a personal recommendation to buy or sell any financial instrument or product, or to adopt any investment strategy as it is not provided based on an assessment of your investing knowledge and experience, your financial situation or your investment objectives. The value of your investments, and the income derived from them, may go down as well as up. You may not get back all the money that you invest. The investments referred to in this article may not be suitable for all investors, and if in doubt, an investor should seek advice from a qualified investment adviser.
Full performance can be found on the company or index summary page on the interactive investor website. Simply click on the company's or index name highlighted in the article.
Disclosure
We use a combination of fundamental and technical analysis in forming our view as to the valuation and prospects of an investment. Where relevant we have set out those particular matters we think are important in the above article, but further detail can be found here.
Please note that our article on this investment should not be considered to be a regular publication.
Details of all recommendations issued by ii during the previous 12-month period can be found here.
ii adheres to a strict code of conduct. Contributors may hold shares or have other interests in companies included in these portfolios, which could create a conflict of interests. Contributors intending to write about any financial instruments in which they have an interest are required to disclose such interest to ii and in the article itself. ii will at all times consider whether such interest impairs the objectivity of the recommendation.
In addition, individuals involved in the production of investment articles are subject to a personal account dealing restriction, which prevents them from placing a transaction in the specified instrument(s) for a period before and for five working days after such publication. This is to avoid personal interests conflicting with the interests of the recipients of those investment articles.