Chart of the week: are Ocado shares a buy now?
Our charts expert considers whether the accident-prone tech firm is worth picking at these low levels.
26th July 2021 12:00
by John Burford from interactive investor
Our charts expert considers whether the accident-prone tech firm and online supermarket is worth picking up at these low levels.
Can a leading-edge company in the online grocery sector have as much bad luck recently as has Ocado (LSE:OCDO)?
It has had three fires in three years with the latest a week ago caused by robots colliding. Yes, welcome to the brave new world of automation in the 21st century.
Naturally, this has adversely impacted the sentiment surrounding automated fulfilment and the recent sell-off in the shares is not a surprise.
- Invest with ii: Top UK Shares | Share Tips & Ideas | Open a Trading Account
But has this set up another contrarian buying opportunity? Certainly, warehouse automation is not going away and although glitches along the way are to be expected, the trend for robotic low-skill operations in industry is firmly up. Robots don't get Covid!
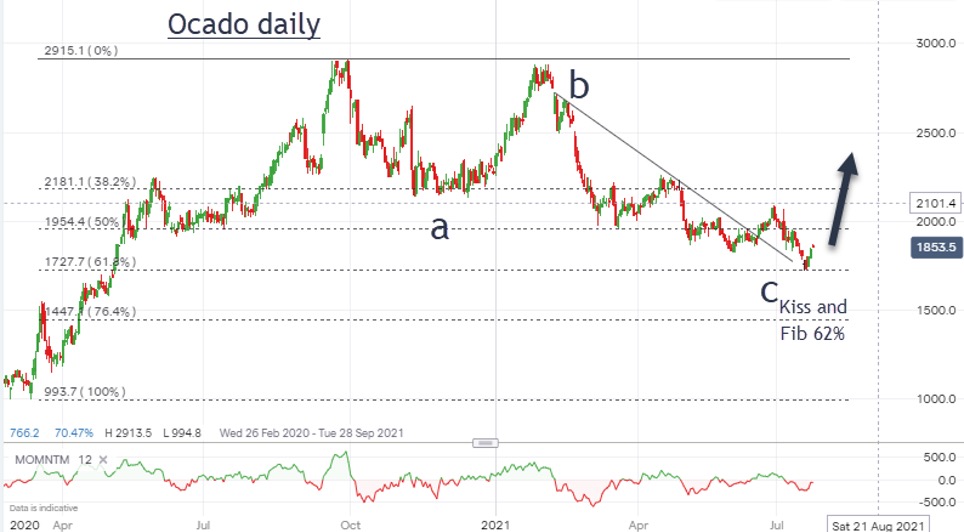
This is the daily chart from last year:
Past performance is not a guide to future performance.
The shares made a high at £29 last September and the ensuing fires and other difficulties dampened the bullish outlook, and the shares fell back but then rose back to test the high.
But then, a worsening outlook culminating in last week's fire sent the shares down to last week's low at £17.50.
But that decline appears in the form of an a-b-c three down pattern with the 'c' wave hitting the important Fibonacci 62% support where reversals often occur.
Note the internal trendline connecting the minor highs on the decline – and the upward beak on 21 June. That was the first sign of a trend change to up.
- Why reading charts can help you become a better investor
- Should investors prepare for an autumn market correction?
- Read more of John Burford's articles here
The shares fell back and have now planted a 'kiss' on that trendline and is currently being repelled upwards in what appears to be a scalded cat bounce up.
Remember, I use that expression to describe the action of the market when it kisses an important line of support/resistance (in this case, support) and moves sharply away from the kiss.
After the kiss, the market often moves away from it very sharply making the very best low risk trade entry as near to the kiss as possible.
And the risk is low because a stop loss can be placed just under the low of the kiss. If we have a genuine kiss, the trade will be in instant profit from the get-go. And that is a superb position to be in.
But if wrong, you will know about it very quickly if the kiss low is taken out. You will suffer a minor loss in that event. That makes this kind of trade a low-risk/high-probability position.
My first target is the £22.50 area.
John Burford is the author of the definitive text on his trading method, Tramline Trading. He is also a freelance contributor and not a direct employee of interactive investor.
These articles are provided for information purposes only. Occasionally, an opinion about whether to buy or sell a specific investment may be provided by third parties. The content is not intended to be a personal recommendation to buy or sell any financial instrument or product, or to adopt any investment strategy as it is not provided based on an assessment of your investing knowledge and experience, your financial situation or your investment objectives. The value of your investments, and the income derived from them, may go down as well as up. You may not get back all the money that you invest. The investments referred to in this article may not be suitable for all investors, and if in doubt, an investor should seek advice from a qualified investment adviser.
Full performance can be found on the company or index summary page on the interactive investor website. Simply click on the company's or index name highlighted in the article.
Disclosure
We use a combination of fundamental and technical analysis in forming our view as to the valuation and prospects of an investment. Where relevant we have set out those particular matters we think are important in the above article, but further detail can be found here.
Please note that our article on this investment should not be considered to be a regular publication.
Details of all recommendations issued by ii during the previous 12-month period can be found here.
ii adheres to a strict code of conduct. Contributors may hold shares or have other interests in companies included in these portfolios, which could create a conflict of interests. Contributors intending to write about any financial instruments in which they have an interest are required to disclose such interest to ii and in the article itself. ii will at all times consider whether such interest impairs the objectivity of the recommendation.
In addition, individuals involved in the production of investment articles are subject to a personal account dealing restriction, which prevents them from placing a transaction in the specified instrument(s) for a period before and for five working days after such publication. This is to avoid personal interests conflicting with the interests of the recipients of those investment articles.