Chart of the week: How to trade Next shares in 2019
31st December 2018 08:15
by John Burford from interactive investor
It will soon kick off the retail sector's Christmas reporting season, but technical analyst John Burford thinks he already knows where Next shares are heading.

Next is following other retailers lower
UK retailers have had a well-publicised dreadful time this past year and none more so than the clothing sector. High Street majors are faring badly, but earlier in the year it appeared those that traded largely online would benefit from the switch from the High Street in the 'Amazon Effect'. Talk was that Next would be immune to the downtrend.
I last covered Next on 14 May and this is what I wrote then: "Marks & Spencer and Debenhams shares are on the floor, but Next seemed to be different – they were building a substantial online presence and held out the potential to escape the fate of those two bricks and mortar giants."
In fact, the share performance of Next was looking quite constructive in May and I had a short-term bullish outlook at the time. This is the chart I showed then:
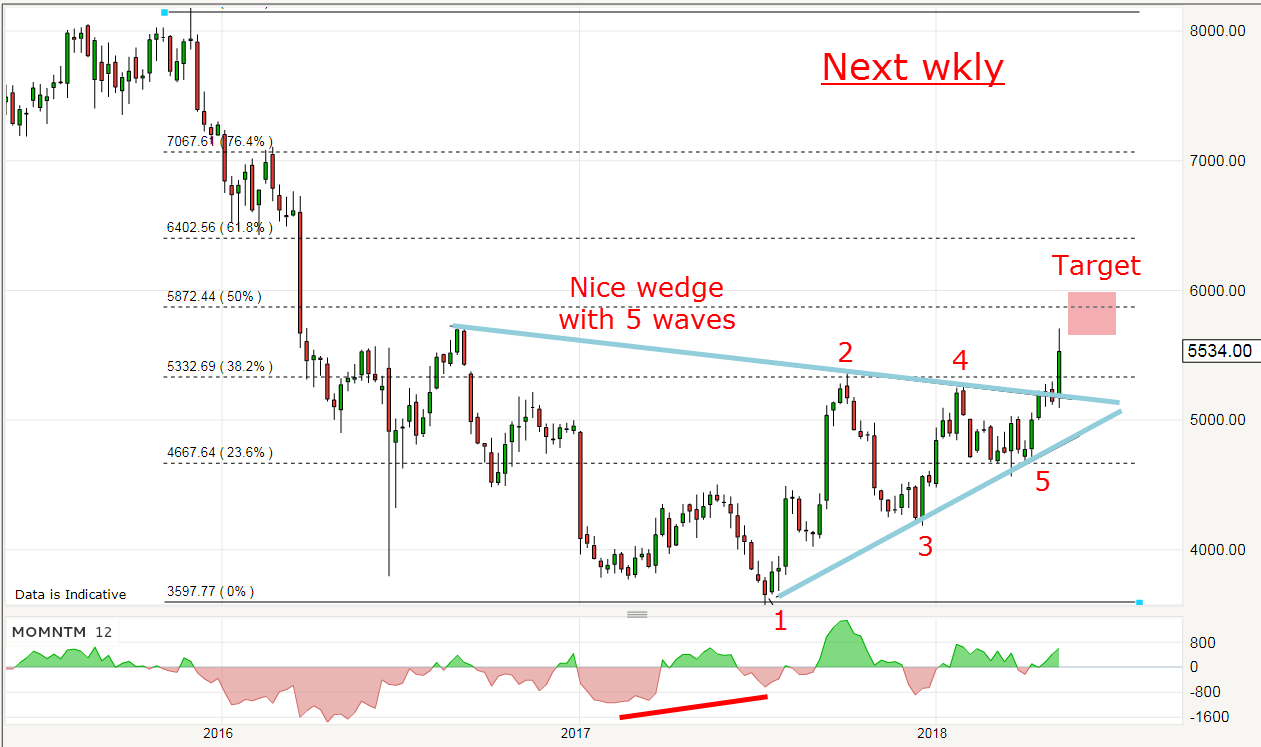
Source: interactive investor Past performance is not a guide to future performance
I had a lovely wedge pattern and had a target of around £58. This is what I wrote:
"Prudence tells me to take at least some profit as a major target is within range. That is a cool gain of £12 (28%). But is there more upside?
"I have to note the weakening momentum into the current rally as a warning sign. But so far, the immediate trend remains up and there should be more fuel in the tank to perhaps push it up to the Fib 62% retrace around the £64 area."
Not only did it reach my target at £58, but I had a higher 'perhaps' target at around £64.
So, what happened after that? Here is the latest daily chart:
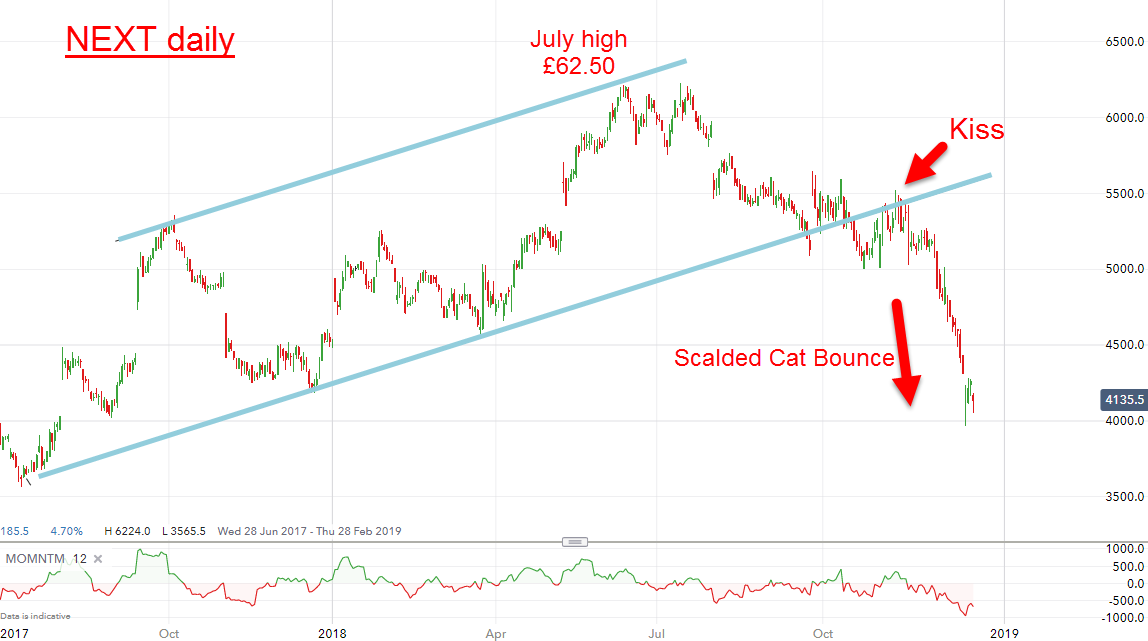
Source: interactive investor Past performance is not a guide to future performance
In fact, the shares did rally for two more months into the July high at £62.50, making my 'perhaps' target slot into the 'not bad' category. At least I had the direction correct (a distinct advantage!).
But from then on, it was downhill all the way as the market slowly woke up to the reality that online retailers would likely not escape the brutal consumer slowdown in progress that has continued to this day.
Technically, the chart is interesting since, on my lower tramline break, the market came back for a kiss goodbye and started a vicious Scalded Cat Bounce down in typical fashion. In fact, this is a textbook example – the slide is very steep.
Now with the shares just above the £40 level, they have lost a third off their high. But that is not as bad as some of the High Street outfits. Debenhams has lost a staggering 90%. Ouch!
Going back to the weekly chart above, the entire rally off the 2017 low is a counter-trend A-B-C three up and now the trend is back to hard down. I really don't see an end to the current slide except for some minor bounces.
With the Brexit farce set to continue well into the New Year, sentiment should remain pretty bearish and who knows what horrors may be lurking in the holiday trading statement to come. If a positive surprise, any rally could be considered shorting opportunities.
Wishing all my readers a very Happy and Prosperous New Year!
For more information about Tramline Traders, or to take a three-week free trial, go to www.tramlinetraders.com.
*Horizontal lines on charts represent levels of previous technical support and resistance.
John Burford is the author of the definitive text on his trading method, Tramline Trading. He is also a freelance contributor and not a direct employee of interactive investor.
These articles are provided for information purposes only. Occasionally, an opinion about whether to buy or sell a specific investment may be provided by third parties. The content is not intended to be a personal recommendation to buy or sell any financial instrument or product, or to adopt any investment strategy as it is not provided based on an assessment of your investing knowledge and experience, your financial situation or your investment objectives. The value of your investments, and the income derived from them, may go down as well as up. You may not get back all the money that you invest. The investments referred to in this article may not be suitable for all investors, and if in doubt, an investor should seek advice from a qualified investment adviser.
Full performance can be found on the company or index summary page on the interactive investor website. Simply click on the company's or index name highlighted in the article.
Disclosure
We use a combination of fundamental and technical analysis in forming our view as to the valuation and prospects of an investment. Where relevant we have set out those particular matters we think are important in the above article, but further detail can be found here.
Please note that our article on this investment should not be considered to be a regular publication.
Details of all recommendations issued by ii during the previous 12-month period can be found here.
ii adheres to a strict code of conduct. Contributors may hold shares or have other interests in companies included in these portfolios, which could create a conflict of interests. Contributors intending to write about any financial instruments in which they have an interest are required to disclose such interest to ii and in the article itself. ii will at all times consider whether such interest impairs the objectivity of the recommendation.
In addition, individuals involved in the production of investment articles are subject to a personal account dealing restriction, which prevents them from placing a transaction in the specified instrument(s) for a period before and for five working days after such publication. This is to avoid personal interests conflicting with the interests of the recipients of those investment articles.