Chart of the week: is it FTSE 100’s turn for a bear market?
13th June 2022 13:52
by John Burford from interactive investor
After hitting a four-week low, and with many overseas markets already in bear territory, analyst John Burford tells us what he thinks will happen to the FTSE 100 in the weeks and months ahead.

The FTSE 100 is hard down – where is the bottom?
The last time I covered the FTSE 100 index was on 7 March when it had broken sharply off a high and appeared to be heading much lower in a third wave. Odds were that the relief rally off the Corona Crash lows had completed and we could look forward – if that was the correct term – to a sharp decline in the general market.
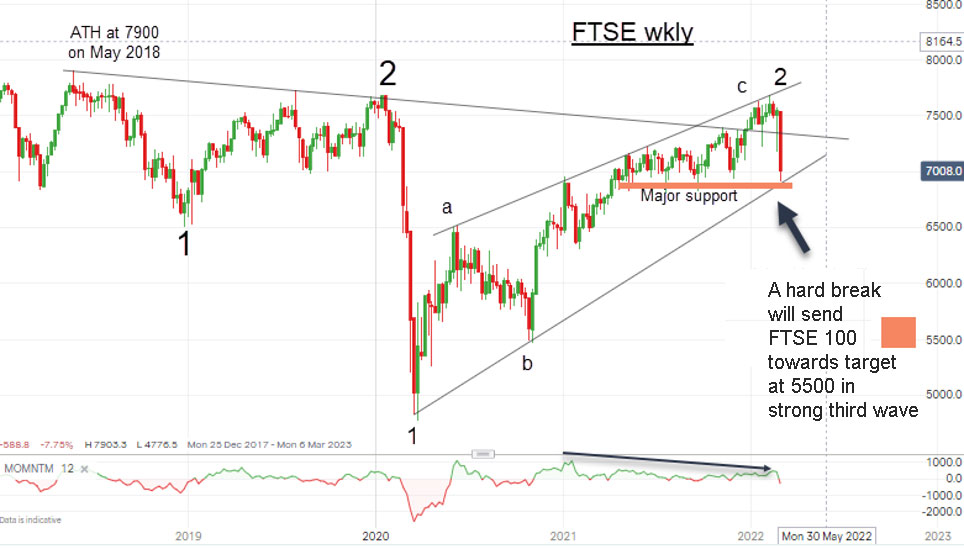
This is the chart I posted then:
Past performance is not a guide to future performance.
I had a strong conviction that the relief rally was in the form of a three-up a-b-c pattern and the recent collapse to the pink major support was a confirming factor.
This is what I wrote then: “Last week saw a strong decline to meet my pink 'Major support' and the uptrend line off the March Corona Crash low. This is my 'line in the sand' support.
“Breaking this support will send it rapidly towards my lower pink target in the 5,500 region, with lower potential.”
- Insider: a post-Covid low triggers buying at this mid-cap
- Richard Beddard: why this is one of my six favourite shares
- Why reading charts can help you become a better investor
So did the market follow my roadmap in April and May? Of course not! In fact, it did initially break below my pink support to the 6,775 low, but then found its legs and roared upwards back past it and managed to test the previous wave 2 high at around 7,600 in April and again last week.
That was indeed unexpected, but this action did obey the old market maxim that markets exist in order to disappoint the majority.
The important point is my overall bearish picture remains intact – the post-Corona Crash rally is a bear market rally in three waves with the May 2018 high of 7,900 standing as the historic all-time high that would last for years.
I have had to slightly adjust the trendlines in the wedge pattern, but the implications remain as I had it in March: expect a resumption of the bear market.
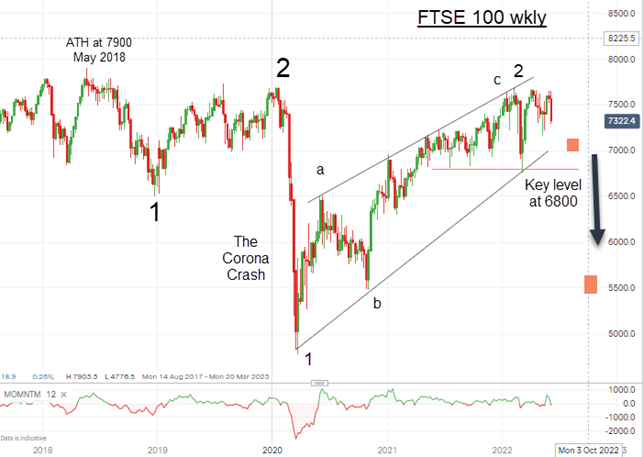
Here is my updated chart:
Past performance is not a guide to future performance.
It shows that the wave 'c' of 2 high at 6,780 that I marked on the March chart remains intact but, in the interim, the market recovered from the low of 6,775 to post a rally back to the 7,680 region on 12 April and again last week.
But late last week, the market responded badly to the recent US CPI data, and that kicked off another sharp decline.
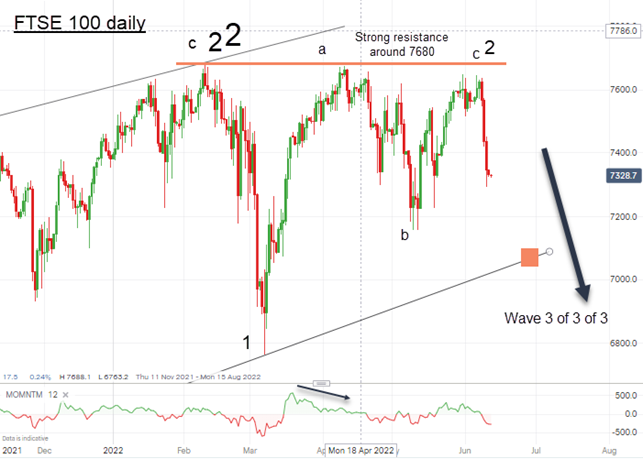
I confess the recent wave patterns had given me a few headaches, but here is my current interpretation on the daily scale:
Past performance is not a guide to future performance.
If my labels are correct, the market is starting a major wave lower in third waves of at least three degrees. This type of wave is usually the longest and strongest in the book. Only a move above the pink zone around 7,680 would send me back to the drawing board.
The implication is clear: expect a major bear run lasting weeks/months where my first major target is in the 5,500 region.
It appears the decline that I had forecast in March had been delayed for three months but, once again, taking a defensive stand now appears to be the most prudent choice.
If you are attracted to taking a short position as a hedge or as an outright position, the Xtrackers FTSE 100 Shrt Daily Swap ETF (LSE:XUKS) is available.
John Burford is a freelance contributor and not a direct employee of interactive investor.
These articles are provided for information purposes only. Occasionally, an opinion about whether to buy or sell a specific investment may be provided by third parties. The content is not intended to be a personal recommendation to buy or sell any financial instrument or product, or to adopt any investment strategy as it is not provided based on an assessment of your investing knowledge and experience, your financial situation or your investment objectives. The value of your investments, and the income derived from them, may go down as well as up. You may not get back all the money that you invest. The investments referred to in this article may not be suitable for all investors, and if in doubt, an investor should seek advice from a qualified investment adviser.
Full performance can be found on the company or index summary page on the interactive investor website. Simply click on the company's or index name highlighted in the article.
Disclosure
We use a combination of fundamental and technical analysis in forming our view as to the valuation and prospects of an investment. Where relevant we have set out those particular matters we think are important in the above article, but further detail can be found here.
Please note that our article on this investment should not be considered to be a regular publication.
Details of all recommendations issued by ii during the previous 12-month period can be found here.
ii adheres to a strict code of conduct. Contributors may hold shares or have other interests in companies included in these portfolios, which could create a conflict of interests. Contributors intending to write about any financial instruments in which they have an interest are required to disclose such interest to ii and in the article itself. ii will at all times consider whether such interest impairs the objectivity of the recommendation.
In addition, individuals involved in the production of investment articles are subject to a personal account dealing restriction, which prevents them from placing a transaction in the specified instrument(s) for a period before and for five working days after such publication. This is to avoid personal interests conflicting with the interests of the recipients of those investment articles.