Chart of the week: Bullish on this FTSE 100 high yielder
28th January 2019 12:06
by John Burford from interactive investor
Fundamentals scream value, and now our technical analyst expects a big bounce at this blue-chip laggard.

I am going to bat for BAT
This is surely one of the most unloved shares on the London Stock Exchange. Not only does the company carry the stigma of being an 'evil' addictive nicotine pusher, but the outlook for cigarette use is for a continued decline globally. Not a pretty picture – at least on the surface.
In fact, since British American Tobacco (LSE:BATS) made its all-time high at £56 in June 2017, it has currently lost about 60% of its value to the current low in the £23.50 region. That makes it a candidate for my 'Buy Low/Sell High' list. So, let's dig a little deeper.
Here is the weekly chart since 2009:
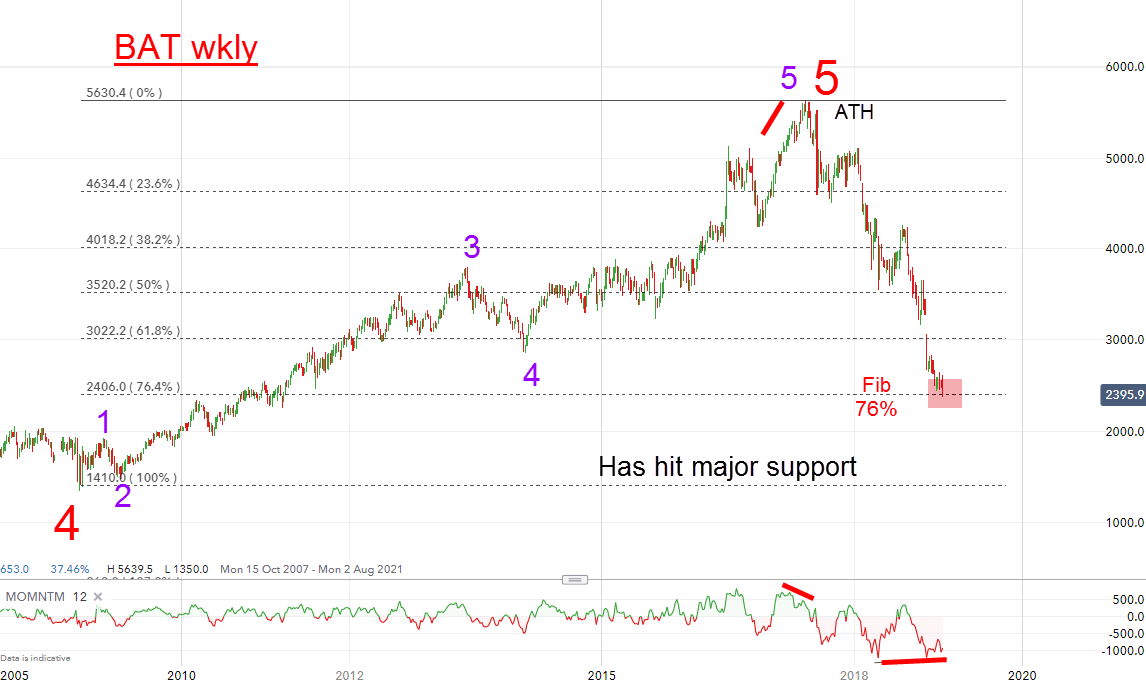
Source: interactive investor Past performance is not a guide to future performance
There are several notable features. First is the textbook purple five-wave pattern in red wave 5. Second is the final wave 5 of 5 also rose into a momentum divergence, indicating a classic buying climax at the £56 high. Third is the decline to a precise hit on the Fibonacci 76% support level. Fourth is the clear five-wave pattern to the decline
At the high, that was a terrific opportunity to take profits on longs and reverse to short, anticipating a decline. That decline could be expected to be in the form of three waves and to last for months – perhaps even a few years. That is what Elliott Wave Theory projects.
Here is a close-up of the decline on the daily chart:
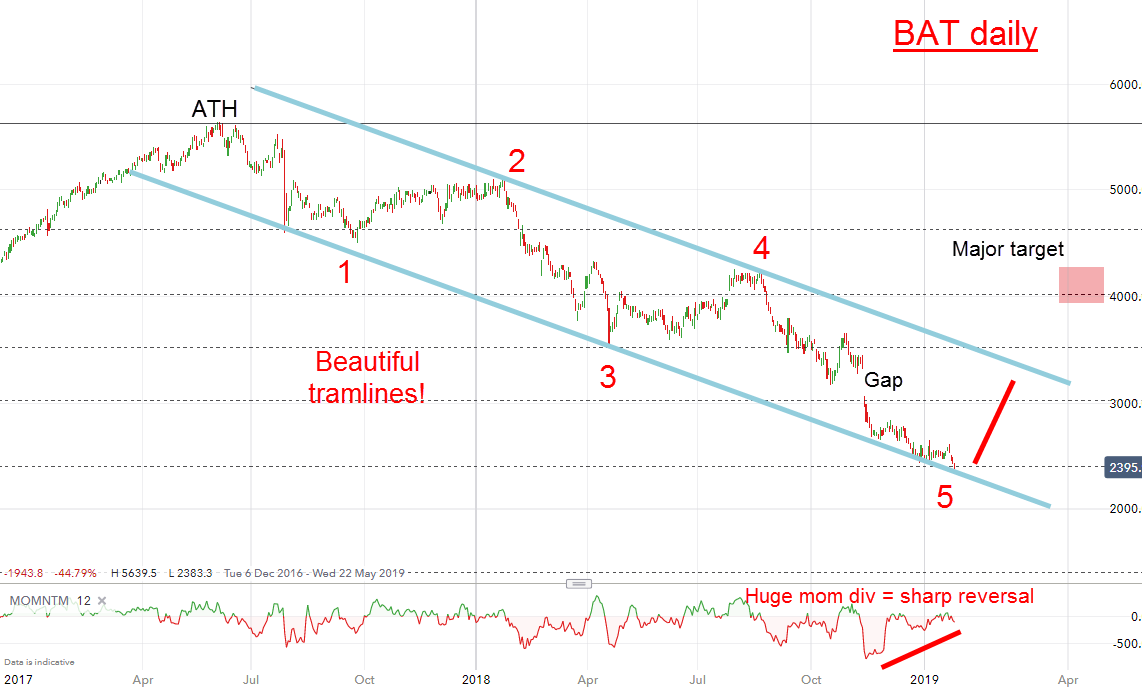
Source: interactive investor Past performance is not a guide to future performance
Lo and behold, I have a textbook tramline pair where the line drawn between the highs of waves 2 and 4 creates the upper tramline and the parallel line underneath conveniently connects the lows of waves 1 and 3. So now, with those tramlines firmly in place, the market has descended in wave 5 right to this lower tramline. This is looking very pretty.
And note the huge momentum divergence this fifth wave has opened up! Look at the bounces off the waves 1 and 3 lows – they were both preceded by decent momentum divergences. If history is any guide – and it usually is in technical analysis – we can expect a similar bounce here but much stronger than before due to the size of the current divergence.
If this is correct, I expect a vigorous rally phase to start soon with the gap as my first target in the £32 area. Overcoming that level sets the upper tramline at around the £34 area as next target. And, with a favourable wind, I can see the £40-£42 area being attained with higher potential.
But as one door closes, another opens up. With tobacco in decline, we have a new hot sector – marijuana. Rivals of BAT are already in that space and it would be a natural for BAT to join them (if they have not done so already). I am bullish on BAT at these levels.
For more information about Tramline Traders, or to take a three-week free trial, go to www.tramlinetraders.com.
John Burford is the author of the definitive text on his trading method, Tramline Trading. He is also a freelance contributor and not a direct employee of interactive investor.
These articles are provided for information purposes only. Occasionally, an opinion about whether to buy or sell a specific investment may be provided by third parties. The content is not intended to be a personal recommendation to buy or sell any financial instrument or product, or to adopt any investment strategy as it is not provided based on an assessment of your investing knowledge and experience, your financial situation or your investment objectives. The value of your investments, and the income derived from them, may go down as well as up. You may not get back all the money that you invest. The investments referred to in this article may not be suitable for all investors, and if in doubt, an investor should seek advice from a qualified investment adviser.
Full performance can be found on the company or index summary page on the interactive investor website. Simply click on the company's or index name highlighted in the article.
Disclosure
We use a combination of fundamental and technical analysis in forming our view as to the valuation and prospects of an investment. Where relevant we have set out those particular matters we think are important in the above article, but further detail can be found here.
Please note that our article on this investment should not be considered to be a regular publication.
Details of all recommendations issued by ii during the previous 12-month period can be found here.
ii adheres to a strict code of conduct. Contributors may hold shares or have other interests in companies included in these portfolios, which could create a conflict of interests. Contributors intending to write about any financial instruments in which they have an interest are required to disclose such interest to ii and in the article itself. ii will at all times consider whether such interest impairs the objectivity of the recommendation.
In addition, individuals involved in the production of investment articles are subject to a personal account dealing restriction, which prevents them from placing a transaction in the specified instrument(s) for a period before and for five working days after such publication. This is to avoid personal interests conflicting with the interests of the recipients of those investment articles.