Chart of the week: Is Tech sector on edge of precipice?
An expected decline could be devastating, according to the charts, and Apple could lead the way.
22nd July 2019 12:58
by John Burford from interactive investor
An expected decline could be devastating, according to the charts, and Apple could lead the way.

Will Apple continue to follow my roadmap?
I thought I would review this perennial favourite since I believe we are on the cusp of a decline in the Nasdaq (of which Apple (NASDAQ:AAPL) is one of its top constituents) that will take many tech shares lower.
Source: interactive investor Past performance is not a guide to future performance
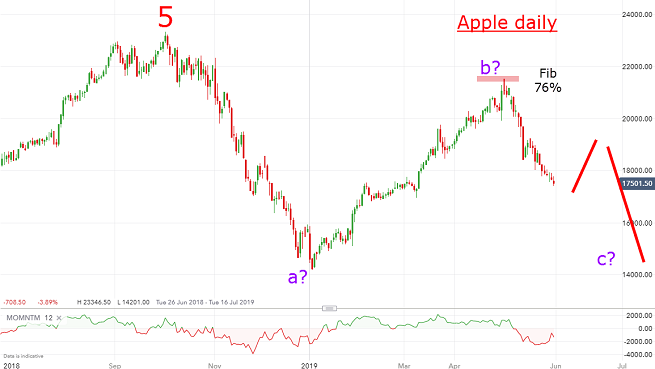
I labelled the $233 high in October last year as the final fifth wave of the entire bull run since its IPO. The first large wave down is an 'a' wave, the bounce off that low is a 'b' wave and the current decline is part of the unfolding 'c' wave.
If these labels are correct, then following any upcoming bounce, the market should decline hard in what is likely to be a third wave, which would be devastating in scope.
And this is what I wrote then:
"My best guess here (latest $175) is for a continued dip to the $170 area, then a bounce to perhaps the $190 - $195 and then a very sharp decline to test the low at $140. Much lower potential exists and last year's $233 top seems very secure."
And here is the updated chart:
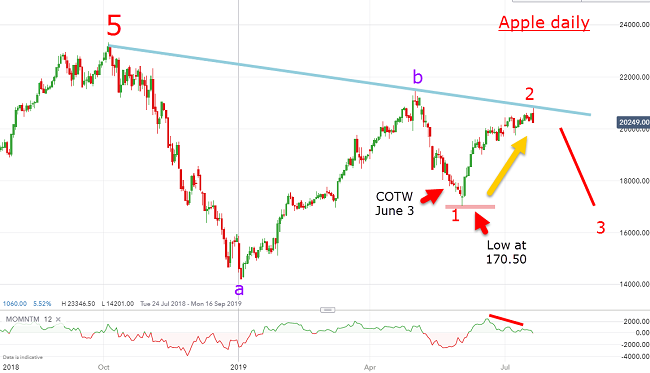
Source: interactive investor Past performance is not a guide to future performance
Bingo! The market dipped to a low of $170.50 one day after my Chart of the week column and then staged a very strong recovery. That reversal occurred bang on my target. And, in fact, the ensuing rally was so strong it carried above my target zone of $190-$195 to a high on Friday at $208.
But that's OK, it only added to profits for a terrific swing trade!
Of course, if you were stalking this market and had bought at my $170 low, you would have set a close stop and be in the money by $38 (22%).
Now that I had very accurately set the roadmap since early June, what is the outlook from here, I hear you ask.
For one thing, at Friday's $208 high it made an accurate hit on the new blue trendline drawn off the two previous highs. This now becomes a line of strong resistance.
For another, a large momentum divergence has been building on the rally – and that spells weakness ahead.
And for another, there is now a weekly key reversal, which is often a reliable reversal signal at the end of a strong move. A key reversal is a feature where the close at the end of the week is lower than the previous week's close and a new high has been made in between. Last week's action certainly fits the bill.
And fourth, Friday's action closed a small gap near the 'b' wave high. Remember, gaps often act as magnets and, once closed, the market reverses.
The bottom line is that I expect my $140 target to be reached on this leg down, and so this current market is an opportunity to abandon any long positions and reverse to short. I will take Friday's $208 high as my fail-safe.
For more information about Tramline Traders, or to take a three-week free trial, go to www.tramlinetraders.com.
John Burford is the author of the definitive text on his trading method, Tramline Trading. He is also a freelance contributor and not a direct employee of interactive investor.
These articles are provided for information purposes only. Occasionally, an opinion about whether to buy or sell a specific investment may be provided by third parties. The content is not intended to be a personal recommendation to buy or sell any financial instrument or product, or to adopt any investment strategy as it is not provided based on an assessment of your investing knowledge and experience, your financial situation or your investment objectives. The value of your investments, and the income derived from them, may go down as well as up. You may not get back all the money that you invest. The investments referred to in this article may not be suitable for all investors, and if in doubt, an investor should seek advice from a qualified investment adviser.
Full performance can be found on the company or index summary page on the interactive investor website. Simply click on the company's or index name highlighted in the article.
Disclosure
We use a combination of fundamental and technical analysis in forming our view as to the valuation and prospects of an investment. Where relevant we have set out those particular matters we think are important in the above article, but further detail can be found here.
Please note that our article on this investment should not be considered to be a regular publication.
Details of all recommendations issued by ii during the previous 12-month period can be found here.
ii adheres to a strict code of conduct. Contributors may hold shares or have other interests in companies included in these portfolios, which could create a conflict of interests. Contributors intending to write about any financial instruments in which they have an interest are required to disclose such interest to ii and in the article itself. ii will at all times consider whether such interest impairs the objectivity of the recommendation.
In addition, individuals involved in the production of investment articles are subject to a personal account dealing restriction, which prevents them from placing a transaction in the specified instrument(s) for a period before and for five working days after such publication. This is to avoid personal interests conflicting with the interests of the recipients of those investment articles.