Chart of the week: Could Apple lose 25% of its value?
As a post-Christmas recovery attracts heavy selling, this analyst forecasts what will happen next.
3rd June 2019 11:22
by John Burford from interactive investor
As a post-Christmas recovery attracts heavy selling, this analyst forecasts what will happen next.
Apple is falling
Since last Autumn, members of the much-vaunted FAANG Gang (Facebook (NASDAQ:FB), Apple (NASDAQ:AAPL), Amazon (NASDAQ:AMZN), Netflix (NASDAQ:NFLX) and Alphabet's Alphabet (NASDAQ:GOOGL)) have seen their share prices in a sharp bear trend (except for Alphabet, which managed to squeak to a new high in April by a whisker).
That wasn't supposed to happen! After all, these giants of the tech world led the Nasdaq up to new highs almost single-handed.
They are all heavily involved in the future with leading edge technologies such as self-driving electric vehicles, space exploration/tourism, medicine and so on. They have massive resources to fund such projects.
But as I never tire of pointing out: when times appear wonderful, that is when tops are put in (and where many investors buy in a 'fear of missing out' (FOMO) panic) – and so it proved with Apple, the one-time darling of the tech world.
But now, times are changing, with the background music becoming more and more discordant. The trade spat with China is now sounding a bum note in the semiconductor industry. Here is the S&P Semiconductor Index SMH showing the 20% decline off its late-April high:
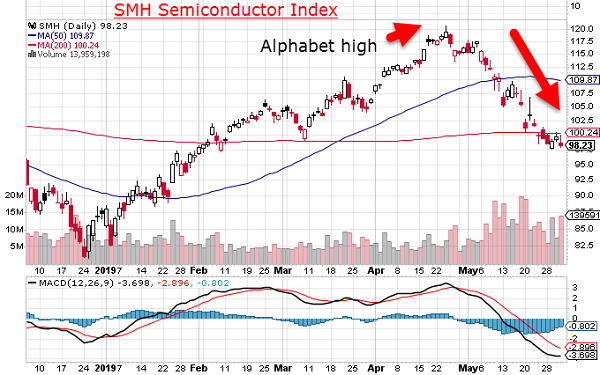
Source: interactive investor Past performance is not a guide to future performance
The month of May saw a sea change in sentiment.
So, let me review where we are with Apple shares and offer my ideas on the road ahead. As always, I like to start with the very long-term chart:
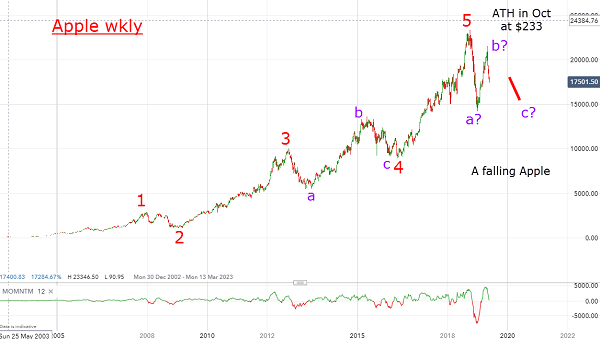
Source: interactive investor Past performance is not a guide to future performance
The 15-year rise to the final fifth wave high has been astonishing. But there have been hiccups along the way before the late Steve Jobs pulled the company around with must-have products that attracted a global army of devoted fans. Remember the iPhone launches that resembled the old-fashioned Harrods Sales of yore in the degree of frenzy they created?
But how times change! Recent products have been greeted mostly by indifference – and rival companies are snapping at Apple's heels all the time.
The all-time high (ATH) was made in October at the $233 level, and from there the rot started to set in, with a plunge to $142 in early January as US/China trade tensions tightened and sales came in flat.
In my May 20 COTW on Amazon, I showed an almost identical plunge in the same time period.
That was not a coincidence. The FAANGs are joined at the hip as they are kept aloft by bullish sentiment towards tech and the general risk on/risk off dynamic. And, of course, without semiconductors, they will all have had their chips – and that industry is having its woes (see first chart above).
Back to Apple, and that setback was clearly overdone (note the extreme low momentum reading indicating an oversold position) and the shares recovered. This is the period I honed in on, as I wanted to see if a new high could be created or, more likely, a sharp reversal to align with the semiconductor index. Here is a close-up of the daily chart:
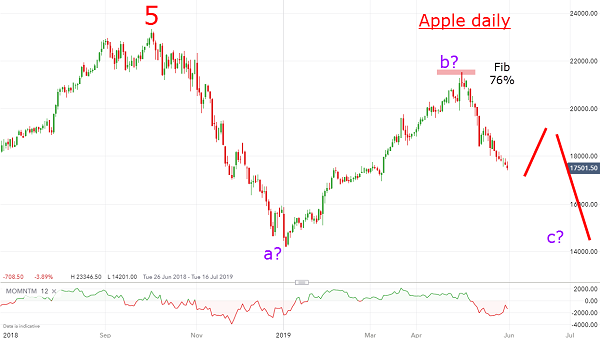
Source: interactive investor Past performance is not a guide to future performance
The Christmas 'a?' wave low on the chart was followed by a vigorous counter-trend rally, where my best guess was for a turn at the Fibonacci 62% retrace at around the $200 region. But it had a little more gas to rise to the Fibonacci 76% 'Last Chance Saloon' retrace at $212. From there, it has been straight down.
My best guess here (latest $175) is for a continued dip to the $170 area, then a bounce to perhaps the $190-$195 and then a very sharp decline to test the low at $140. Much lower potential exists, and last year's $233 top seems very secure.
For more information about Tramline Traders, or to take a three-week free trial, go to www.tramlinetraders.com.
John Burford is the author of the definitive text on his trading method, Tramline Trading. He is also a freelance contributor and not a direct employee of interactive investor.
These articles are provided for information purposes only. Occasionally, an opinion about whether to buy or sell a specific investment may be provided by third parties. The content is not intended to be a personal recommendation to buy or sell any financial instrument or product, or to adopt any investment strategy as it is not provided based on an assessment of your investing knowledge and experience, your financial situation or your investment objectives. The value of your investments, and the income derived from them, may go down as well as up. You may not get back all the money that you invest. The investments referred to in this article may not be suitable for all investors, and if in doubt, an investor should seek advice from a qualified investment adviser.
Full performance can be found on the company or index summary page on the interactive investor website. Simply click on the company's or index name highlighted in the article.
Disclosure
We use a combination of fundamental and technical analysis in forming our view as to the valuation and prospects of an investment. Where relevant we have set out those particular matters we think are important in the above article, but further detail can be found here.
Please note that our article on this investment should not be considered to be a regular publication.
Details of all recommendations issued by ii during the previous 12-month period can be found here.
ii adheres to a strict code of conduct. Contributors may hold shares or have other interests in companies included in these portfolios, which could create a conflict of interests. Contributors intending to write about any financial instruments in which they have an interest are required to disclose such interest to ii and in the article itself. ii will at all times consider whether such interest impairs the objectivity of the recommendation.
In addition, individuals involved in the production of investment articles are subject to a personal account dealing restriction, which prevents them from placing a transaction in the specified instrument(s) for a period before and for five working days after such publication. This is to avoid personal interests conflicting with the interests of the recipients of those investment articles.