Chart of the week: When trading gods smile on you
A textbook example of how to use basic chart methods to pinpoint when a stock has bottomed out.
27th August 2019 12:40
by John Burford from interactive investor
A textbook example of how to use basic chart methods to pinpoint when a stock has bottomed out.

Just Eat follows my roadmap precisely
Sometimes, the trading gods smile down on you and offer you an irresistible setup for an excellent reversal trade, where the timing is perfect and with very low risk of failure and where the potential profits are very high. And so it was with my Just Eat (LSE:JE.) COTW of 10 June.
This is a textbook example of how to use basic chart methods to pinpoint such an opportunity to catch a major bottom in real time. Remember, most analysts advise not to try to pick tops and bottoms but to 'trade with the trend'. Of course, they say that because they have not learned how to do it! And it's a lot safer for the reputation than otherwise.
And if you are able to zoom in on tops and bottoms with decent accuracy, your profits are so much larger than jumping on a trend that may well be about to terminate anyway. Who wants to be the last one holding the parcel?
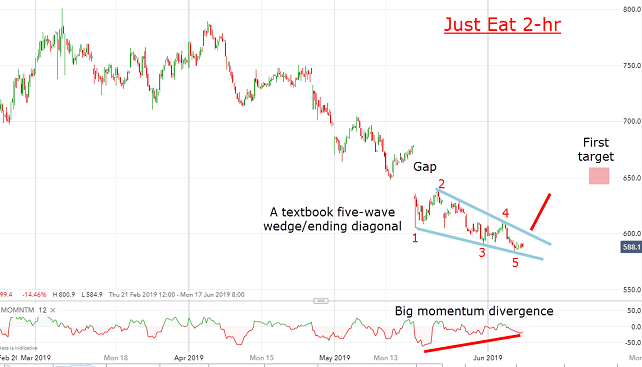
So, this was the short-term chart I displayed last time. It showed the market was in a bear phase and so in a position for a possible bottom – provided I could read the signals correctly.
In fact, I noted the looming momentum divergence on the way down – a sure sign that selling pressure was on the wane and that eventually, the growing buying force would stop the rot and put in a low. So my job in June was to locate any tell-tale signs for a turn up – and I was not to be disappointed.
Source: interactive investor Past performance is not a guide to future performance
The latest waves down followed a textbook five-wave wedge (or ending diagonal).
This is what I wrote in June:
"And up pops a classic ending pattern in the shape of a five-wave wedge (or ending diagonal) accompanied by a huge momentum divergence. Any push above upper wedge line at just above the 600p level would very likely send the shares scooting rapidly up to my first target around 650p."
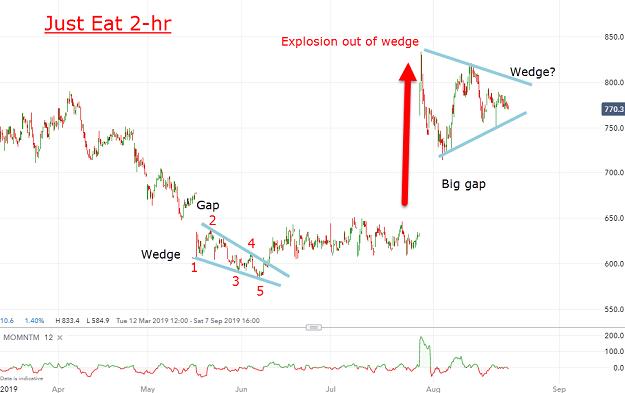
So did I find the bottom at 585p on 6 June? Here is the chart updated to last Friday:
Source: interactive investor Past performance is not a guide to future performance
Indeed. After punching above the upper wedge line at 600p (my buy signal), the shares entered a lengthy consolidation between 600p and 650p which served to put us all to sleep waiting for something to happen.
And then something did happen – and it was an explosive rally to 830p on 29 July, opening up a gigantic gap which validated my forecast for a sharp reversal out of the momentum divergence and the small wedge. It blew my first target at 650p out of the water. In fact, the first trade after 630p was above 800p on that day.
So, my protective stop under 585p was safe and untouched. A long entry at 600p risked 15p and produced a potential 200p profit for a reward/risk ratio of over 13 – a most satisfactory result.
And, since then, the shares have been consolidating those massive gains and seem to be forming another wedge. That could be what some call a bull flag which would be confirmed by a push above the upper blue wedge line. In that event, a target above the old high at 900p can be entertained.
Incidentally, please note that I have not referred to any data surrounding the company, nor its competitive position in the world of food delivery services to achieve this result. This is deliberate, since detailed knowledge of such data can severely impact my decision-making as a swing trader.
For more information about Tramline Traders, or to take a three-week free trial, go to www.tramlinetraders.com.
John Burford is the author of the definitive text on his trading method, Tramline Trading. He is also a freelance contributor and not a direct employee of interactive investor.
These articles are provided for information purposes only. Occasionally, an opinion about whether to buy or sell a specific investment may be provided by third parties. The content is not intended to be a personal recommendation to buy or sell any financial instrument or product, or to adopt any investment strategy as it is not provided based on an assessment of your investing knowledge and experience, your financial situation or your investment objectives. The value of your investments, and the income derived from them, may go down as well as up. You may not get back all the money that you invest. The investments referred to in this article may not be suitable for all investors, and if in doubt, an investor should seek advice from a qualified investment adviser.
Full performance can be found on the company or index summary page on the interactive investor website. Simply click on the company's or index name highlighted in the article.
Disclosure
We use a combination of fundamental and technical analysis in forming our view as to the valuation and prospects of an investment. Where relevant we have set out those particular matters we think are important in the above article, but further detail can be found here.
Please note that our article on this investment should not be considered to be a regular publication.
Details of all recommendations issued by ii during the previous 12-month period can be found here.
ii adheres to a strict code of conduct. Contributors may hold shares or have other interests in companies included in these portfolios, which could create a conflict of interests. Contributors intending to write about any financial instruments in which they have an interest are required to disclose such interest to ii and in the article itself. ii will at all times consider whether such interest impairs the objectivity of the recommendation.
In addition, individuals involved in the production of investment articles are subject to a personal account dealing restriction, which prevents them from placing a transaction in the specified instrument(s) for a period before and for five working days after such publication. This is to avoid personal interests conflicting with the interests of the recipients of those investment articles.