Chart of the week: A new FTSE 100 stock to trade
Battered recently, this blue-chip has now reached a price where an advance can be confidently forecast.
10th June 2019 11:47
by John Burford from interactive investor
Battered recently, this blue-chip has now reached a price where an advance can be confidently forecast.

Will Just Eat just beat the competition?
The shares of this FTSE 100 food delivery service have certainly been on a roller-coaster recently. It achieved stunning early growth, but then worries emerged when rival companies started to eat into Just Eat's (LSE:JE.) prospects, especially Deliveroo and Uber Eats. All of a sudden, the field looks very crowded.
So, with sentiment trending down, is it time to buy? After all, short interest is running pretty high (over 6% of Just Eat's stock is out on loan to short sellers) and any decent bounce would bound to be magnified in a short squeeze.

Source: interactive investor Past performance is not a guide to future performance
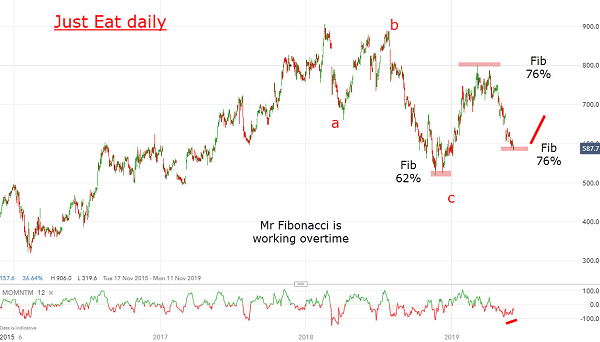
In accordance with my time-honoured practice, I will start with the long-term picture for perspective. The rally off the February 2016 low at the £3 area has been impressive, making a high at £9 exactly two years later. But, since then, as the new rivals started snapping at its heels, volatility has surged with wide swings up and down – and just the kind of action I love to analyse!
The decline off that £9 high displays a three-down appearance that implies a correction to the main trend, which is up. And the 'c' wave turned at the precise Fibonacci 62% retrace of the entire bull run. Major market turns are most often made from this and the 50% levels.
And from this low at £5.30, the advance continued right to the exact Fibonacci 76% resistance and then turned down. And at current levels, it has retraced another Fibonacci 76% of the previous wave up – and on a momentum divergence.
So, the current area at around £5.90 is a strong candidate for a low from which another advance can be confidently forecast.
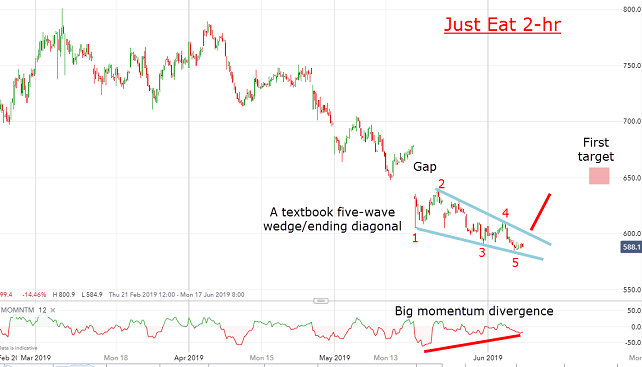
And here is a close-up of the latest action on the 2-hour chart:

Source: interactive investor Past performance is not a guide to future performance
And up pops a classic ending pattern in the shape of a five-wave wedge (or ending diagonal) accompanied by a huge momentum divergence. Any push above my upper wedge line at just above the £6 level would very likely send the shares scooting rapidly up to my first target at around £6.50.
And there is a bonus! In case I am wrong, a long trade here can be covered with a close 'sell' stop-losses just below the recent low to protect capital.
A more conservative tactic would be to set ‘buy’ stops above the £6 level so as to catch the wave if and when it breaks the upper wedge line resistance.
Flash – Monday morning. I wrote the report on the weekend and as I write this morning, the shares are opening higher and currently testing the upper wedge line. Initial signs are that we have the low in place.
For more information about Tramline Traders, or to take a three-week free trial, go to www.tramlinetraders.com.
John Burford is the author of the definitive text on his trading method, Tramline Trading. He is also a freelance contributor and not a direct employee of interactive investor.
These articles are provided for information purposes only. Occasionally, an opinion about whether to buy or sell a specific investment may be provided by third parties. The content is not intended to be a personal recommendation to buy or sell any financial instrument or product, or to adopt any investment strategy as it is not provided based on an assessment of your investing knowledge and experience, your financial situation or your investment objectives. The value of your investments, and the income derived from them, may go down as well as up. You may not get back all the money that you invest. The investments referred to in this article may not be suitable for all investors, and if in doubt, an investor should seek advice from a qualified investment adviser.
Full performance can be found on the company or index summary page on the interactive investor website. Simply click on the company's or index name highlighted in the article.
Disclosure
We use a combination of fundamental and technical analysis in forming our view as to the valuation and prospects of an investment. Where relevant we have set out those particular matters we think are important in the above article, but further detail can be found here.
Please note that our article on this investment should not be considered to be a regular publication.
Details of all recommendations issued by ii during the previous 12-month period can be found here.
ii adheres to a strict code of conduct. Contributors may hold shares or have other interests in companies included in these portfolios, which could create a conflict of interests. Contributors intending to write about any financial instruments in which they have an interest are required to disclose such interest to ii and in the article itself. ii will at all times consider whether such interest impairs the objectivity of the recommendation.
In addition, individuals involved in the production of investment articles are subject to a personal account dealing restriction, which prevents them from placing a transaction in the specified instrument(s) for a period before and for five working days after such publication. This is to avoid personal interests conflicting with the interests of the recipients of those investment articles.