Commodities Focus: Will the copper rout ever stop?
6th August 2018 13:30
by Rajan Dhall from interactive investor
Industry analyst Rajan Dhall discusses where investors should expect oil, gold and copper prices to move this week.

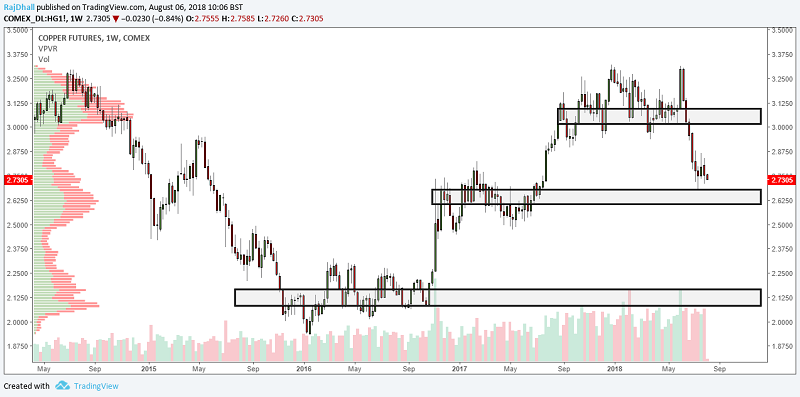
Copper prices are subdued again as more talks on tariffs hit the markets. A big reason for concern for the industrial metal is the weakening on the CNY (Chinese Yuan). For firms to buy industrial metals and any product for that matter, it is getting more and more expensive as the USD/CNY pair strengthens.
Just recently, China's move to place retaliatory tariffs on $60 billion of U.S. goods took place and this clearly shows they are not backing down from a trade war. The scale of the situation is shown in the fact that China imported 432,944 tonnes of copper concentrate from the United States in 2017, its eight-biggest supplier according to Chinese customs data (Reuters). China is also said to be the world's largest consumer of the metal, accounting for half of all consumption.
Looking closer to home, all of the biggest UK listed miners have been struggling. KAZ Minerals has fallen heavily but let's not forget the company announced a new acquisition. BHP Billiton has also struggled and Rio Tinto has fallen 10% since 24th July alone. The important thing to watch out for now is when is the price 'too low'?
I have highlighted a few areas on the chart where buyers and sellers have exchanged the most amount of contracts at price. This (for me) represents where buyers and sellers are happy to meet and conduct business. We have rejected a downside more recently but if we get more information about LME warehouse data increasing and lower sales volume we could breach it.
The chart also has volume data along the bottom - if there are areas where price is supported on high volume this can also be an indication that the market may be bottoming out. As such, the next few weeks are pivotal.

Past performance is not a guide to future performance
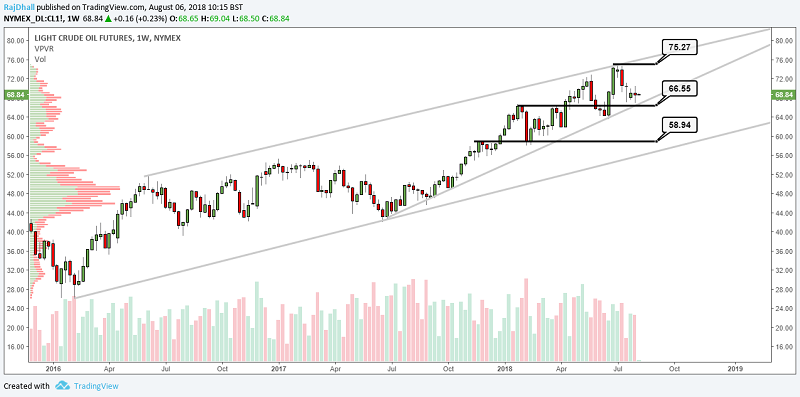
At the moment WTI oil seems to be a sideways story for summer markets.
The OPEC production increases have been priced in and now we await fresh news on global demand from the EIA and IEA. On the weekly chart below you can see we are stalling between two important price levels and price may hover here until more details are released.
It's unlikely we will make a challenge for the highs even as stories emerge that Saudi Arabia scales back production. For now, it seems Russia and Saudi Arabia will be happy with $70bbl and sideways price action will continue.

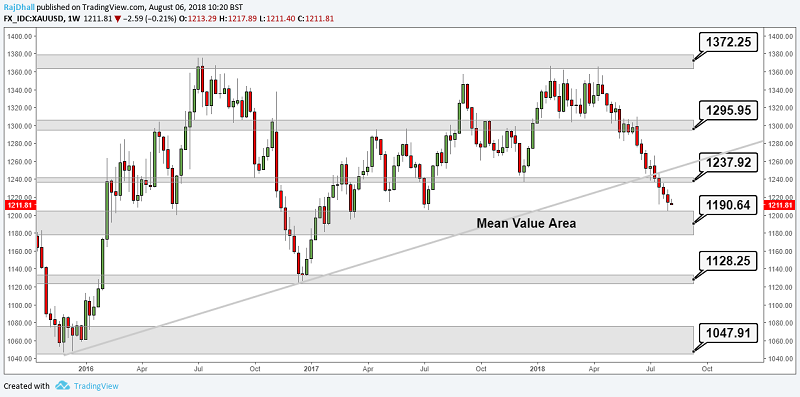
The gold market continues to confound many at the moment. The precious metal continues to fall as the trade spat between the US and China continues. There is a clear correlation between USD/CNY and gold and more stories of central bank buying seem to hit the market. The interest rate hikes from the Fed are almost certainly priced in and now geopolitical tension could send the metal climbing.
A strong US economy is a worry (for gold) and if the numbers keep improving gold could lose more of its lustre as investors plump for US Treasuries. Just this weekend JP Morgan's Dimon stated that he thinks US 10 year yields could reach 5%. If this were to be the case we could see more downside in the precious metal.

Past performance is not a guide to future performance
These articles are provided for information purposes only. Occasionally, an opinion about whether to buy or sell a specific investment may be provided by third parties. The content is not intended to be a personal recommendation to buy or sell any financial instrument or product, or to adopt any investment strategy as it is not provided based on an assessment of your investing knowledge and experience, your financial situation or your investment objectives. The value of your investments, and the income derived from them, may go down as well as up. You may not get back all the money that you invest. The investments referred to in this article may not be suitable for all investors, and if in doubt, an investor should seek advice from a qualified investment adviser.
Full performance can be found on the company or index summary page on the interactive investor website. Simply click on the company's or index name highlighted in the article.