Commodities outlook: Big clues to direction of gold
It is hard for gold to keep pushing when stocks are rallying, but there are some signs to watch for.
29th November 2019 13:02
by Rajan Dhall from interactive investor
It is hard for gold to keep pushing when stocks are rallying, but there are some signs to watch for.
Gold seems delicately poised at the moment as the market awaits key risk events.
Looking at the weekly chart below, the price has consolidated in recent weeks into a bull flag formation (marked in red). Since the break of $1,400, the price hit a high of $1,565 per ounce.
Now, it seems that it was a step too far to move into the next distribution area between $1,565 per ounce and $1,917.9 per ounce. View now is that the price could be making a consolidation pattern between $1,374.9 and $1,565 per ounce. This sounds like a massive range, but it is hard for gold to keep pushing when stocks are rallying with such vigour.
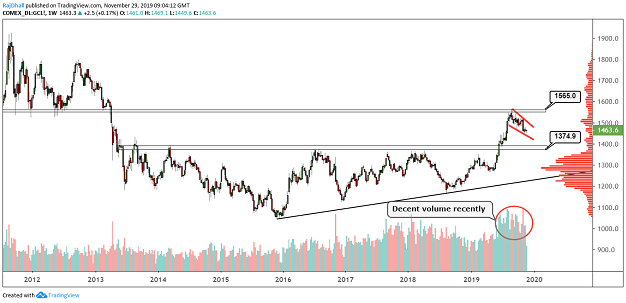
Source: TradingView Past performance is not a guide to future performance
On the daily chart, the price waves are still making lower highs and lower lows and, on a shorter-term basis, $1,446.2 per ounce is the next support level in focus. If the level breaks, then that would make the fourth consecutive wave low and potentially put the bull flag formation under threat.
Lastly, the most interesting thing on the chart is the volume. It has increased dramatically during this period of indecision. For clues, if the flag pattern breaks on high volume it may give us an indication on the future conviction of the market.
Red metal
Copper had a great start to the week after positive comments on trade over the weekend. During the week following the protestor (Hong Kong) sympathetic law being passed in the US, the markets have pulled back somewhat. The market felt that this law could potentially cause some issues for the "phase one" trade deal. China warned it would take "firm counter measures" in response to US President Donald Trump signing into law legislation that supports protesters in Hong Kong.
On more of a micro level, combined copper stocks in LME, Shanghai Futures and China bonded warehouses totalled 593,000 tonnes, the lowest level since at least 2013, according to Refinitiv data. There was also some poor data this week from China as industrial profits fell 2.9% year to date for the month of October. That does not paint a great picture in the medium term.
Looking at the chart now, and it's clear that the market is in an indecisive phase. This week’s candle could close as a ‘gravestone doji’ - a bearish reversal candlestick pattern for followers of technical analysis. Still, the main price for the bulls to target is $2.73 per ounce level as, if it breaks, it would make another wave high after two consecutive higher lows and higher high waves.
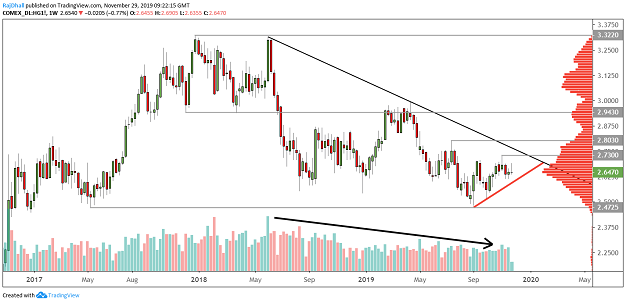
Source: TradingView Past performance is not a guide to future performance
On the next chart, I want to highlight is the correlation between gold and copper. The spread between the two has converged, showing the improvement in the global risk appetite.
The chart demonstrates the year-to-date difference and, after crossing lower in June and diverging heavily, there has been a strong pullback. Moving forward, another crossover would be bullish for risk, so it may be worth keeping an eye on this if you are long stocks.
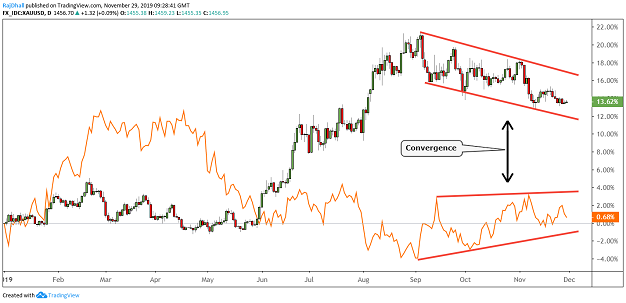
Source: TradingView Past performance is not a guide to future performance
Rajan Dhall is a freelance contributor and not a direct employee of interactive investor.
These articles are provided for information purposes only. Occasionally, an opinion about whether to buy or sell a specific investment may be provided by third parties. The content is not intended to be a personal recommendation to buy or sell any financial instrument or product, or to adopt any investment strategy as it is not provided based on an assessment of your investing knowledge and experience, your financial situation or your investment objectives. The value of your investments, and the income derived from them, may go down as well as up. You may not get back all the money that you invest. The investments referred to in this article may not be suitable for all investors, and if in doubt, an investor should seek advice from a qualified investment adviser.
Full performance can be found on the company or index summary page on the interactive investor website. Simply click on the company's or index name highlighted in the article.