Commodities outlook: Buy gold, sell oil?
Resource markets reflect a huge spike in stock market volatility, with very different results.
6th March 2020 12:15
by Rajan Dhall from interactive investor
Resource markets reflect a huge spike in stock market volatility, with very different results.

It has been a wild ride in the macro markets over the last week, with the Federal Reserve, Bank of Canada and the Reserve Bank of Australia all cutting interest rates. Of course, this is in relation to the coronavirus outbreak which has also played havoc on commodities exchanges. Much of the focus for stock markets now is the fiscal and monetary stimulus measures and spread of the virus.
In commodities markets, the focus remains on consumption, and rightly so. The OPEC oil cartel has taken the decision to cut production by 1 million barrels per day, and their allies, including Russia, have also agreed to reduce output by another 500,000 barrels. So far, the Russians have not agreed on a deal, but it is said to be close.
The issue with the OPEC cuts is leaks in the media. Originally, the cut was supposed to be around 600,000 barrels. It was then leaked to the media via source reports that 1.5 million was expected, which the market duly priced in. Once the amount was confirmed, the market was disappointed and the price fell, even though this cut was higher than the original estimates.
Looking at the technicals, there has been a break lower on the weekly chart below. The trendline break is significant, and indicates that the futures price might even reach the previous support level of $42.49 per barrel. The next major level on the way down is $35 per barrel.
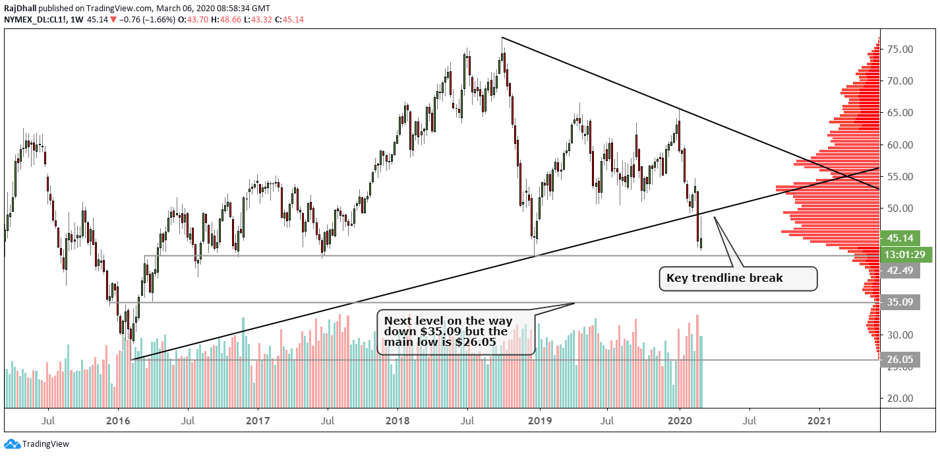
Source: TradingView Past performance is not a guide to future performance
Gold has benefitted from the fall in global stock markets and flight to ‘safe’ assets, and the price is at levels not tested since early 2013 (see chart below).
The key resistance on the upside is now $1,700 per ounce as it has been a psychological level in the past. If that is broken, next level is $1,795.90 per ounce which was the 2013 wave peak.
The technicals have worked pretty well so far as, after the acceleration higher from the channel (marked by the two black lines on the chart), the market retested the top of the structure and moved higher yet again. If the top of the wave is broken, the market could target the next aforementioned resistance.
Trading volume is still backing the move higher but last week’s peak was followed by a strong sell-off, with the volume peak coming from that day. This could obviously be profit-taking and, if the spread of the virus accelerates beyond estimates, the yellow metal could push even higher.
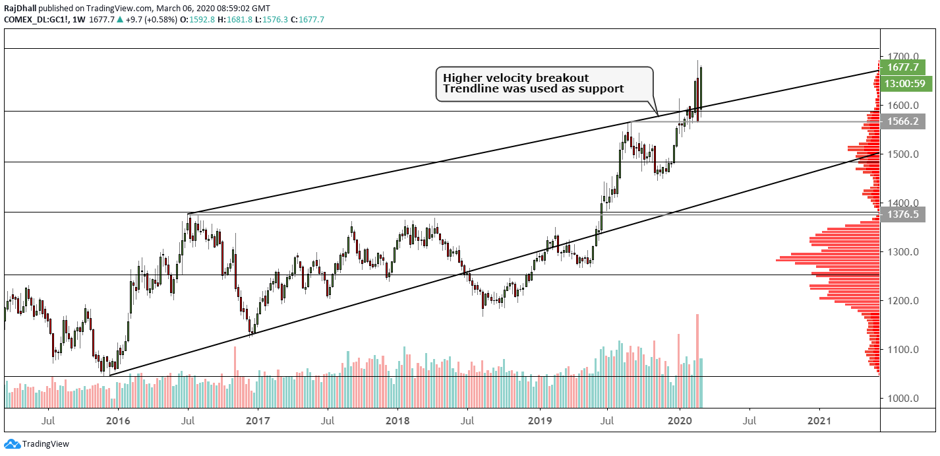
Source: TradingView Past performance is not a guide to future performance
Rajan Dhall is a freelance contributor and not a direct employee of interactive investor.
These articles are provided for information purposes only. Occasionally, an opinion about whether to buy or sell a specific investment may be provided by third parties. The content is not intended to be a personal recommendation to buy or sell any financial instrument or product, or to adopt any investment strategy as it is not provided based on an assessment of your investing knowledge and experience, your financial situation or your investment objectives. The value of your investments, and the income derived from them, may go down as well as up. You may not get back all the money that you invest. The investments referred to in this article may not be suitable for all investors, and if in doubt, an investor should seek advice from a qualified investment adviser.
Full performance can be found on the company or index summary page on the interactive investor website. Simply click on the company's or index name highlighted in the article.