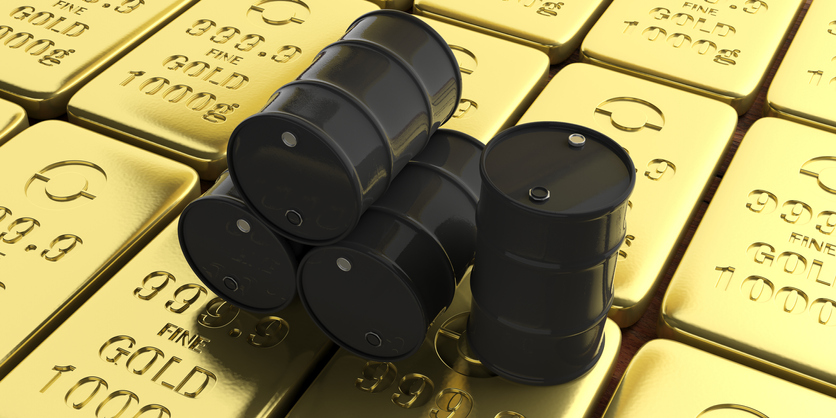
Commodities outlook: Could oil hit $26 as investors buy gold?
With coronavirus widespread, our financial markets analyst studies prospects for the resource sector.
28th February 2020 12:36
by Rajan Dhall from interactive investor
With coronavirus widespread, our financial markets analyst studies prospects for the resource sector.
The markets are in dangerous territory as the coronavirus risk-off theme deepens. Stock markets are selling off everywhere and, crucially, sectors that use commodities are grinding to a halt. The travel industry has been especially hard hit, and this affects oil, while manufacturing in China has slowed dramatically, pushing copper and iron ore prices lower.
The issue is now not mainland China but contagion in Europe and the US. China seems to have things under control if you believe media reports, but in countries like Italy and France, this issue is just getting started.
Looking at the weekly oil chart below, you can see we have moved into the next price distribution lower. The price has moved away from the mean value area (represented by the bell curve in red), putting the $42.49 per barrel support zone in focus.
If that level breaks, then the price could move back to the lows seen in early 2016 of $26.05 per barrel on the futures contract. The key thing to watch out for is any intervention from OPEC. As the price is dropping to historical support levels, they may need to curb supply to deal with the lack of demand from the worst affected areas.
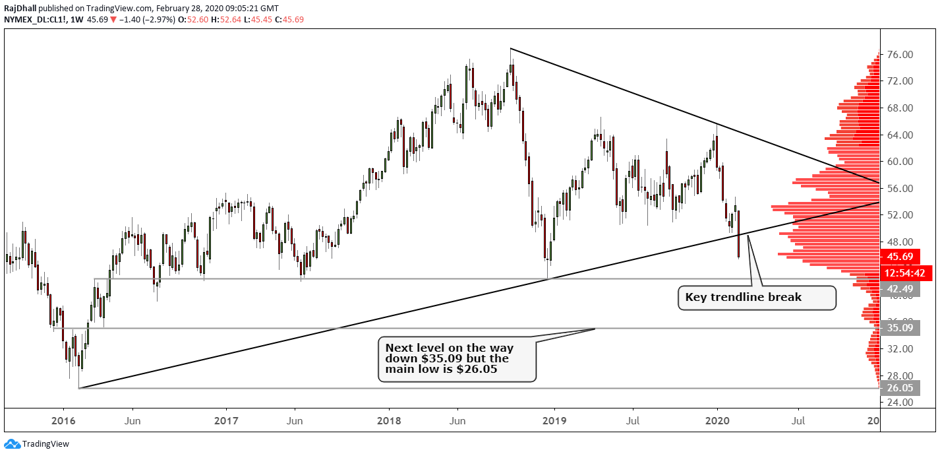
Source: TradingView Past performance is not a guide to future performance
The copper chart (below) is holding up much better than oil. This is interesting as copper will be heavily affected, but this may be due to Chinese media reports that the contagion rate is slowing. Either way, we will soon hear from the like of BHP, Glencore and Anglo American about how much the virus has affected demand.
This could lead to another drop in prices to the next distribution area down, which has a support level of $2.32 per pound. It is hard to imagine prices moving that low, but back in mid-2016 the price hit $1.9355 per pound after falling from a high of $4.6495 in early 2011. Worse things have happened to the red metal.
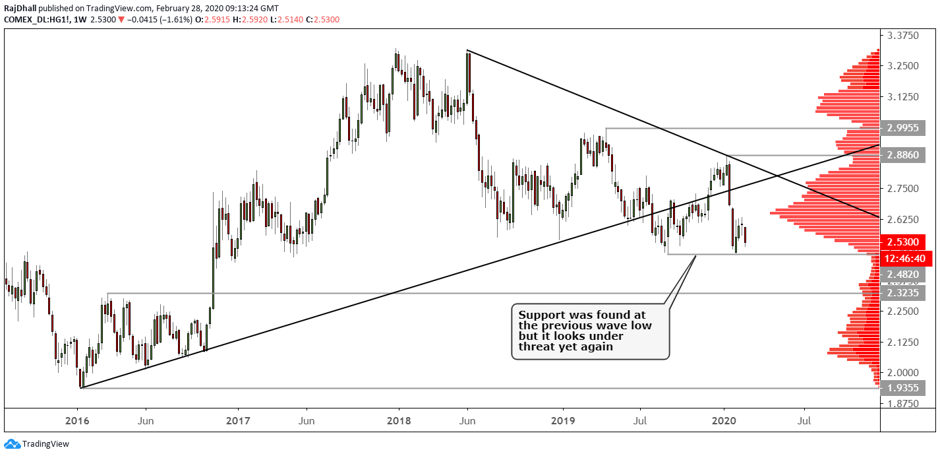
Source: TradingView Past performance is not a guide to future performance
Given most readers are equities traders and investors, it will pay to keep a close eye on this situation as there is no telling at the moment how bad it can get.
Lots of funds are moving sections of their portfolios into safe-haven assets such as gold and fixed income (see gold price chart below). And ETFs and funds offering such services have seen larger than normal inflows away from riskier investments.
Gold futures daily chart

Source: TradingView Past performance is not a guide to future performance
Rajan Dhall is a freelance contributor and not a direct employee of interactive investor.
These articles are provided for information purposes only. Occasionally, an opinion about whether to buy or sell a specific investment may be provided by third parties. The content is not intended to be a personal recommendation to buy or sell any financial instrument or product, or to adopt any investment strategy as it is not provided based on an assessment of your investing knowledge and experience, your financial situation or your investment objectives. The value of your investments, and the income derived from them, may go down as well as up. You may not get back all the money that you invest. The investments referred to in this article may not be suitable for all investors, and if in doubt, an investor should seek advice from a qualified investment adviser.
Full performance can be found on the company or index summary page on the interactive investor website. Simply click on the company's or index name highlighted in the article.