Commodities outlook: Find out what's really moving prices
At a sensitive time for geopolitics, we make sense of latest activity in global resource markets.
18th October 2019 12:46
by Rajan Dhall from interactive investor
At a sensitive time for geopolitics, we make sense of latest activity in global resource markets.
The general landscape in commodities markets has been interesting this week. A lower dollar has not spurred the bulls too much as the global economic slowdown story has capped potential gains.
Last week we had the trade meeting between China and the US in Washington. Things went well between the two nations, but no deal was reached. Instead, the two superpowers are set to meet in Chile next month at the Asia-Pacific Economic Cooperation (APEC) meeting to sign a "Phase one" deal. The tone of the talks was said to be positive, with China stating they are to boost agricultural purchases. However, since the meeting, it has been said there are conditions attached.
On the oil markets, WTI has taken a hit this week as Turkey and Syria seem to be de-escalating the issues at the border. Turkey said yesterday it would allow Kurdish forces some time to leave the area before it may start attacking the area again. Incidentally, there have been some witness accounts of more violence despite the ceasefire.
Away from conflict, both the Department of Energy (DoE) and American Petroleum Institute (API) inventory levels produced a surprise build this week. After bad weather in the US, it seems the refineries are playing catch up and producing more oil.
Chatter in the market suggests OPEC may pre-emptively add to cuts instead of waiting until next year. There are certainly risks to demand, as the current outlook for 2019 oil demand won’t even reach 900,000 barrels per day, and 2020 looks no better with US slowing and China missing on their GDP estimates last night.
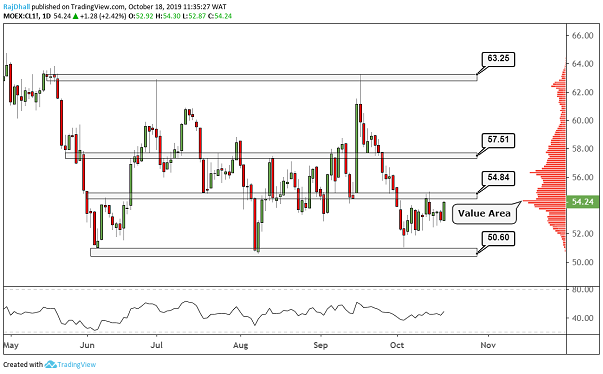
Looking at the daily WTI futures contract below, you can see that the support level of $50.60 per barrel was not even tested. Now the rumour mill is churning, the price is starting to move toward the $54.84 per barrel value area.
In line with this level is the value area represented by the volume profile indicator on the right-hand side of the chart. This shows the price where most contracts have been traded. You can see the peak of the bell curve is near where the price is at the moment.
These levels act as a magnet for the price, and we might find some intraday resistance there. The price may consolidate around this level as traders await more information from OPEC.
Source: TradingView Past performance is not a guide to future performance
Copper has been an interesting one. The price rose slightly after the US-China trade talks but not by much as the actual trade deal was not signed. Last night, Chinese GDP data may have dampened spirits, but the industrial production number did beat expectations, and there were some comments that the Chinese government could support markets further by adding more stimulus.
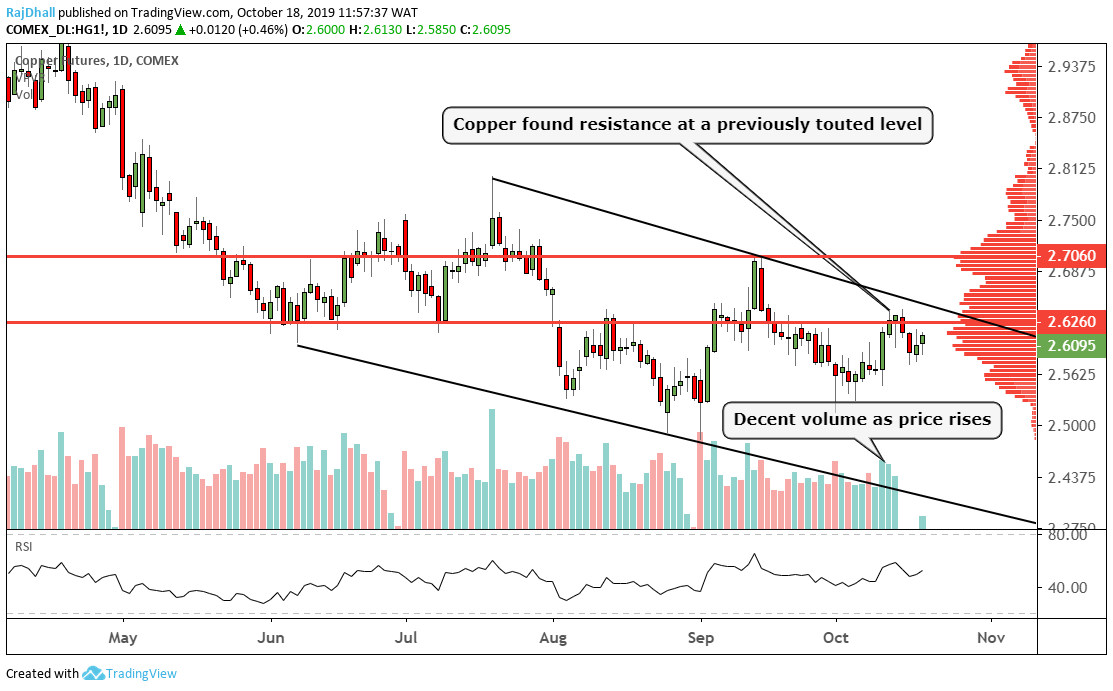
Looking at the daily copper futures chart below, you can see the price has been edging higher. The softer dollar and positives from China are now managing to filter through to price action.
The resistance level of $2.62 per pound managed to hold but, if the bulls gather more momentum, we could see $2.70 tested again. A possible obstacle is another internal trendline that could meet the price at $2.65. However, the main level to keep an eye on is $2.6415. If it breaks, the copper price would have made a 'higher low, higher high' wave pattern.
Source: TradingView Past performance is not a guide to future performance
Rajan Dhall is a freelance contributor and not a direct employee of interactive investor.
These articles are provided for information purposes only. Occasionally, an opinion about whether to buy or sell a specific investment may be provided by third parties. The content is not intended to be a personal recommendation to buy or sell any financial instrument or product, or to adopt any investment strategy as it is not provided based on an assessment of your investing knowledge and experience, your financial situation or your investment objectives. The value of your investments, and the income derived from them, may go down as well as up. You may not get back all the money that you invest. The investments referred to in this article may not be suitable for all investors, and if in doubt, an investor should seek advice from a qualified investment adviser.
Full performance can be found on the company or index summary page on the interactive investor website. Simply click on the company's or index name highlighted in the article.