Commodities outlook: Gold, copper, central banks and the virus
Metal markets are not immune from coronavirus effects, but there’s much more going on here.
6th February 2020 10:44
by Rajan Dhall from interactive investor
Metal markets are not immune from coronavirus effects, but there’s much more going on here.
Commodities markets have been dominated by the risks posed by the coronavirus. What is interesting at the moment is that the markets have started pricing risk away from rapid expansion and global pandemic. This is due to reports of a cure being put into production, although there has been no official confirmation.
Stocks have also started to move higher as a result, the S&P 500, Nasdaq and Dow are still making record highs, even though all the risks have not fully subsided.
Looking closer at the asset classes, and gold has been an interesting one to follow. Even putting the coronavirus trade to one side, the underlying stories remain intact.
The Chinese central bank (PBoC) is still increasing storage levels for the precious metal and this looks set to continue for some time, while other central banks are loosening monetary policy. Both of provide the yellow metal with constant underlying strength.
Coronavirus provided a good excuse to push the gold back to previous highs. The market stopped just short of the previous wave high of $1,630.3 per ounce, but it was a good run nevertheless.
The chart below shows the prominent pattern which could be described as a wedge. The top trendline connecting the recent high waves is key. If this breaks it could indicate that the bulls are not done yet, and $1,613.3 per ounce might be under threat once again.
On the downside, the support level at the $1,536 per ounce area is also a key level to watch. If it breaks, the market would have made a new lower-high/lower-low pattern.
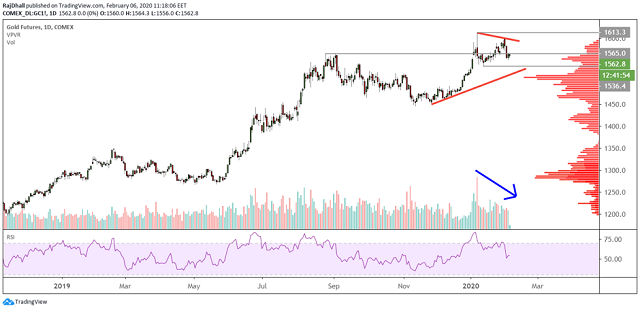
Source: TradingView Past performance is not a guide to future performance
The daily copper chart below is a thing of beauty. China is the world’s largest consumer of the red metal and Dr Copper has been hit hard.
The market clearly overdid it on the sell-side, and now there has been a small retracement. If the situation is really resolved, we could see another move back into the value area. This is represented by the peak of the bell curve on the right-hand side of the chart at around $2.65 per pound.
There are some pretty obvious resistance levels in the way, with $2.60 per pound being used in the past many time both as support and resistance. As always keep an eye on news flow as, if the coronavirus situation gets any worse, we could see another attack on the lows, though the signs are not pointing in that direction for now.
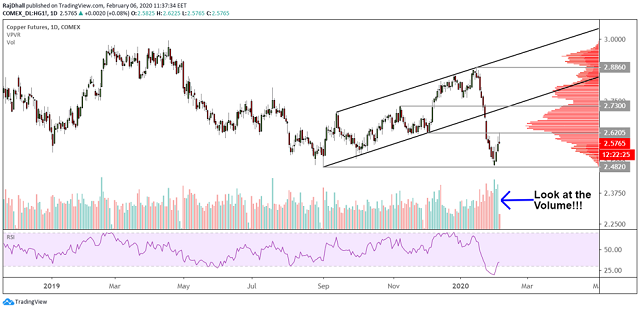
Source: TradingView Past performance is not a guide to future performance
Rajan Dhall is a freelance contributor and not a direct employee of interactive investor.
These articles are provided for information purposes only. Occasionally, an opinion about whether to buy or sell a specific investment may be provided by third parties. The content is not intended to be a personal recommendation to buy or sell any financial instrument or product, or to adopt any investment strategy as it is not provided based on an assessment of your investing knowledge and experience, your financial situation or your investment objectives. The value of your investments, and the income derived from them, may go down as well as up. You may not get back all the money that you invest. The investments referred to in this article may not be suitable for all investors, and if in doubt, an investor should seek advice from a qualified investment adviser.
Full performance can be found on the company or index summary page on the interactive investor website. Simply click on the company's or index name highlighted in the article.