Commodities outlook: Gold glitters, but no support for copper
Coronavirus is testing the usual market patterns, with gold rising alongside stocks and the US dollar.
20th February 2020 11:10
by Rajan Dhall from interactive investor
Coronavirus is testing the usual market patterns, with gold rising alongside stocks and the US dollar.

In macro markets, something amazing is going on with the traditional correlations traders and investors watch. Gold, stocks and the US dollar are all rising together, despite being assets which normally diverge.
There are key reasons for this. One is the outflow of capital from Asia due to coronavirus fears.
At the end of the day, investors are still looking for yield. There is not much out there in other major nations so the US dollar and US assets are winning the race. The rise in gold also really shows at the same time the risks that are still present in the markets too.
Gold has broken out of the chart pattern below and just recently took out the previous wave high of $1,613.3 per ounce. If there is a pullback then the top of the pattern could be used as support, which often happens, but also the psychological $1,600 per ounce could come into play.
Above these current levels, there is not much traffic on the way to the all-time high of $1,923.7 per ounce. $1,683.8 per ounce was a sticky level back between August 2011 and May 2012 and beyond that $1,800 per ounce was also used as a support and resistance zone.
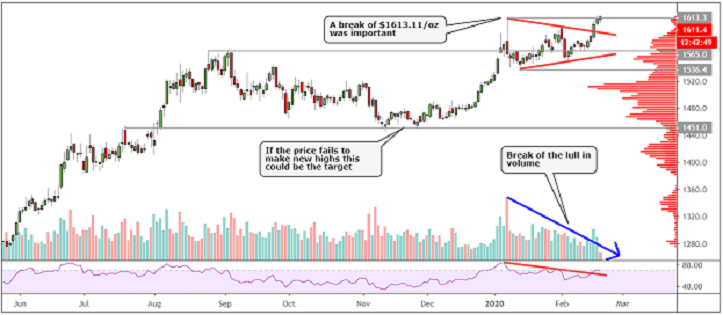
Source: TradingView Past performance is not a guide to future performance
Copper has just rejected a significant resistance zone and may continue its trend lower. Beijing is now a ghost town, China has not yet recovered from this virus. This is one of the busiest cities in the world and can be a leading indicator to the price action in the base metals markets.
China is the world's largest consumer of base metals and its consumption amounts to just over 50% of the world's demand. Once the issues slow down and the nation gets back to some kind of normality we could see recovery, but for now the story is not over.
Looking at the technicals now, $2.4820 per pound is the key level on the downside. Below that $2.4725 and $2.4480 per ounce and the next support zones on the downside.
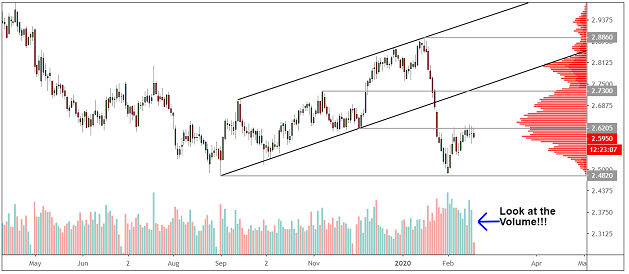
Source: TradingView Past performance is not a guide to future performance
Longer-term (weekly) copper chart
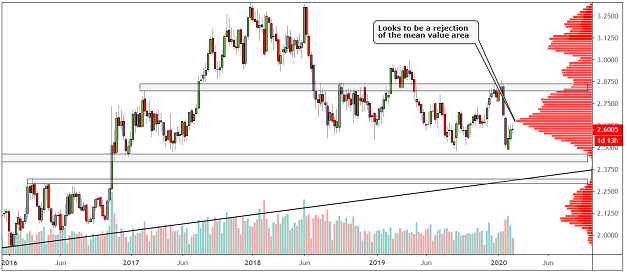
Source: TradingView Past performance is not a guide to future performance
Rajan Dhall is a freelance contributor and not a direct employee of interactive investor.
These articles are provided for information purposes only. Occasionally, an opinion about whether to buy or sell a specific investment may be provided by third parties. The content is not intended to be a personal recommendation to buy or sell any financial instrument or product, or to adopt any investment strategy as it is not provided based on an assessment of your investing knowledge and experience, your financial situation or your investment objectives. The value of your investments, and the income derived from them, may go down as well as up. You may not get back all the money that you invest. The investments referred to in this article may not be suitable for all investors, and if in doubt, an investor should seek advice from a qualified investment adviser.
Full performance can be found on the company or index summary page on the interactive investor website. Simply click on the company's or index name highlighted in the article.