Commodities outlook: Oil rally and gold vs copper
Resource stocks cheered oil and copper price rises, and our financial analyst has some new targets.
6th December 2019 12:23
by Rajan Dhall from interactive investor
Resource stocks cheered oil and copper price rises, and our financial analyst has some new targets.
This week has been mostly about oil and OPEC rather than the US-China trade war, although there have been some developments there too.
Yesterday and today, OPEC delegates meet in Vienna to discuss whether the cartel should increase and extend production cuts in order to stabilize oil prices. In late trading on energy markets there were reports that OPEC members agreed to cut production by 500,000 barrels per day. This is all set to be confirmed once the report is published.
Despite agreeing to a new round of cuts, West Texas Intermediate (WTI) and Brent crude fell slightly after the usual market rumours hyped the market into thinking the cut would be deeper and for longer. During yesterday's session, there were reports of a 1.3 million barrel per day cut and an extension to the end of 2020. As it happens the deal is set to run to April and then it will be reviewed.
Elsewhere in the oil markets, US production remains at record levels, but inventories declined this week. Both American Petroleum Institute (API) and Department of Energy (DoE) readings reported a draw in inventory levels.
Looking at the weekly chart now, you can see we still have not broken out of recent ranges. This week, the price is currently 5.8% higher, so the $60.38 per barrel level is in focus.
The overall chart pattern is a triangle, and the price is now heading toward the apex, with a break in either direction inevitable.
Looking at the levels of volume, it seems we have moved away from the volume profile peak. This is the price where the market exchanged most contracts on the NYMEX exchange.
Also, on the volume histogram below the conviction of the move seems to be light. This could be because we are in an area of average value. When we move away toward support and resistance levels, the volume will then become more important.
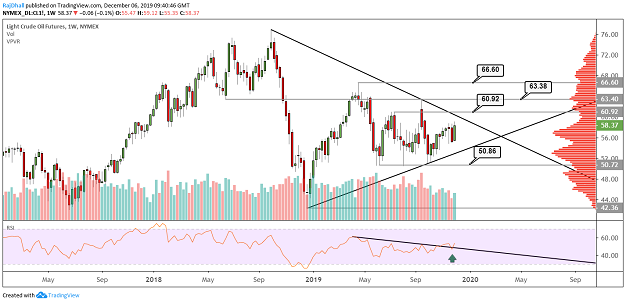
Source: TradingView Past performance is not a guide to future performance
Gold vs Copper
The chart below shows the correlation between gold (Orange line) and copper (Candlesticks). You can a strong divergence between the two in the middle of the year, but now a convergence appears to be taking place. This is a signal that risk appetite has improved and is a consequence of trade talks between China and the US improving.
Despite some recent issues over the treatment of protestors in Hong Kong, this week started off on a sour note for risk. That’s because President Trump said he could wait until after the US election to sign the trade deal with China. But overnight, and in typical Trump fashion, the US leader said talks are progressing and they potentially could get a deal before 15th December when the new set of tariffs could be enacted.
So, again, headline watching is key and a potential copper break higher is on the cards.
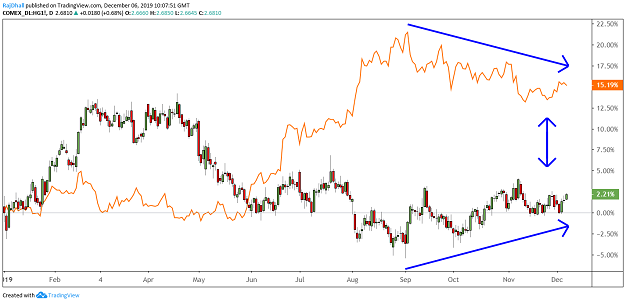
Source: TradingView Past performance is not a guide to future performance
Rajan Dhall is a freelance contributor and not a direct employee of interactive investor.
These articles are provided for information purposes only. Occasionally, an opinion about whether to buy or sell a specific investment may be provided by third parties. The content is not intended to be a personal recommendation to buy or sell any financial instrument or product, or to adopt any investment strategy as it is not provided based on an assessment of your investing knowledge and experience, your financial situation or your investment objectives. The value of your investments, and the income derived from them, may go down as well as up. You may not get back all the money that you invest. The investments referred to in this article may not be suitable for all investors, and if in doubt, an investor should seek advice from a qualified investment adviser.
Full performance can be found on the company or index summary page on the interactive investor website. Simply click on the company's or index name highlighted in the article.