Commodities outlook: Oil selling overdone?
Heading rapidly lower for over a month, this analyst wonders if sellers have been overenthusiastic.
5th June 2019 12:59
by Rajan Dhall from interactive investor
Heading rapidly lower for over a month, this analyst wonders if sellers have been overenthusiastic.

Both oil instruments – West Texas Intermediate (WTI) and Brent crude - have taken a real pounding this week as 'Tariff Man' Trump continues to damage global growth prospects.
World Bank is the latest to cut forecasts, arguing that a slowdown in China is hitting global growth hard. The US and China account for about one-third of world economic growth and they believe uncertainty triggered by the trade war is causing major investors to sit on the sidelines.
Currently, the World Bank expects growth of 2.6% in 2019, edging up to 2.7% the following year. This is below the January forecasts when the organisation downgraded its outlook for growth from 3% to 2.9%.
Elsewhere, Russia continues to reiterate a commitment to the OPEC+ production cut. Its Energy Minister Alexander Novak recently said he will meet his Saudi counterpart Al Falih on 10 June in Russia.
Novak and Falih are said to be discussing bilateral trade and economic cooperation, joint projects in energy and agriculture, according to the ministry. In a statement, he also confirmed that Russia cut oil output by 317,000 barrels per day on average in May versus October 2018 levels; encouraging signs.
Mood blackens for oil
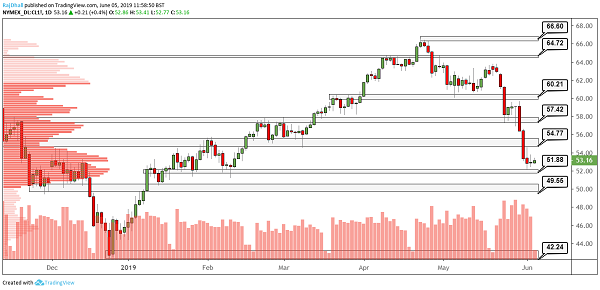
From a technical perspective, oil price action is still bearish, but does could possibly be overextended on the daily chart.

Source: TradingView Past performance is not a guide to future performance
WTI futures have stalled ahead of the $50 per barrel area which is clearly a psychological target. However, longer-term fundamental factors like issues in the Middle East could come to the fore if Iran or the US escalate tensions.
The $56 per barrel area could be a formidable resistance level to any recovery. Watch latest figures from the Department of Energy (DoE), out today. Any drawdown in inventory could inspire a price rise. Conversely, any build in stockpiles could mean we are heading lower to the next support level.
Little respite for red metal
Copper futures have managed to find some relief from the weakening US dollar this week.
US Federal Reserve chair Jerome Powell indicated that the US central bank is willing to act if there is a downturn in the economy, leading analysts to begin premature talk of rate cuts.
Other than this small reprieve received from the greenback, things are still looking bleak for the base metal. Not even supply issues at a Codelco mine could inspire some upside momentum.
Donald Trump began another round of tariffs on Mexico, causing another drop in copper prices last week. Any news that Mexico is controlling immigration into the US could push the commodity higher, but the Mexican president is unwilling to move on current policy.
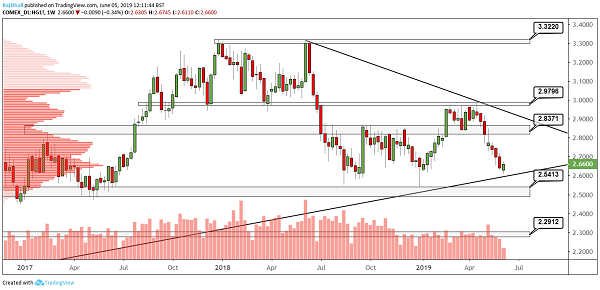
On the weekly chart below, we still have not hit the uptrend line which could lend price support at around the $2.60 per pound area. But the consolidation low of $2.54 per pound seems to be the analyst's base level bearish target and, once again, the headlines are the key driver here.

Source: TradingView Past performance is not a guide to future performance
These articles are provided for information purposes only. Occasionally, an opinion about whether to buy or sell a specific investment may be provided by third parties. The content is not intended to be a personal recommendation to buy or sell any financial instrument or product, or to adopt any investment strategy as it is not provided based on an assessment of your investing knowledge and experience, your financial situation or your investment objectives. The value of your investments, and the income derived from them, may go down as well as up. You may not get back all the money that you invest. The investments referred to in this article may not be suitable for all investors, and if in doubt, an investor should seek advice from a qualified investment adviser.
Full performance can be found on the company or index summary page on the interactive investor website. Simply click on the company's or index name highlighted in the article.