Commodities outlook: why oil price won’t rise after OPEC+ deal
Oil prices remain near historic lows, while gold is surging higher. Our analyst makes sense of it all.
16th April 2020 12:30
by Rajan Dhall from interactive investor
Oil prices remain near historic lows, while gold is surging higher. Our analyst makes sense of it all.
Oil markets were in a state of panic as Saudi Arabia and Russia bickered over a deal among OPEC+ member states to cut crude production. Saudi Arabia was fed up taking the brunt of production cuts and had vowed to increase production to a normal level around 12 million barrels per day. A deal only happened after President Trump began mediating between the two nations.
Trump promised to cut US production to get Russia and Saudi Arabia to agree a new deal but, to me, the US President’s bullishness - he announced on Twitter that there would be a mammoth cut of 12 million barrels per day - caused a significant problem.
The OPEC+ meeting took place last week, and the nations then agreed on a deal to take around 10 million barrels off the market - the US, Saudi Arabia and Russia will contribute production cuts from 11 million barrels per day to 8.5 million barrels per day each - falling short of Trump’s 12 million-barrel promise.
But why did the US step in? Shale producers have an average production cost of around $42 per barrel according to the International Monetary Fund (IMF). This means that many of them face closure or bankruptcy if the oil price is too low for a sustained period.
Looking at the West Texas Intermediate (WTI) weekly oil futures chart below, you can see that the price is still trading very close to the lows. We must wait and see if the price pulls higher to the $26.05 per barrel resistance zone.
Right now, the trend is heavily negative, but it's hard to see it breaking below $20 per barrel again after this deal has been announced. That said, stranger things have happened.
Oil chart since late 2014
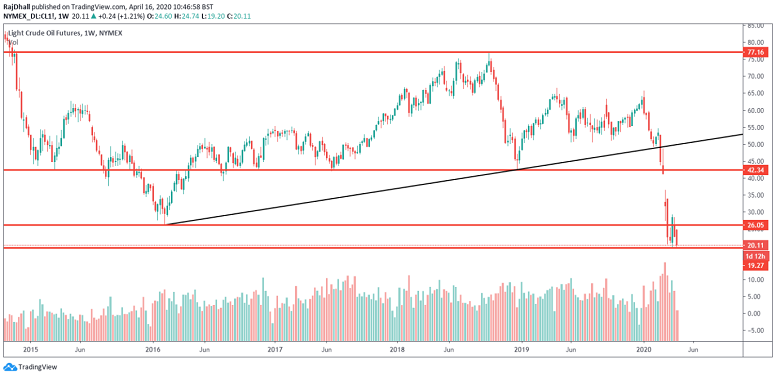
Source: TradingView Past performance is not a guide to future performance
Oil chart since March 2019
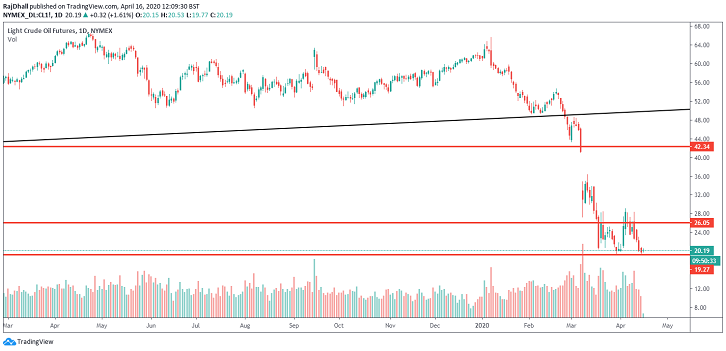
Source: TradingView Past performance is not a guide to future performance
Gold rush
Investors in gold are sitting pretty at the moment as the yellow metal rests near multi-year highs.
The weekly gold futures chart below highlights the key resistance zones the bulls might be aiming for as the upward trend continues. Next up for the precious metal is $1,798.1 per ounce and, if that breaks, the all-time high stands at $1,923.7.
On the spot contract it is much closer to $2,000 per ounce, so I would look out for that psychological level if the $1,800 per ounce breaks.
The economic situation might be worse than the forecasts are suggesting, and money is becoming more and more worthless as the central banks keep the printing more cash. The only issue here is the bouts of US dollar strength that keep flowing into the market.
Keep an eye on this one as gold will tell us the real economic story, not stocks.
Long-term gold chart
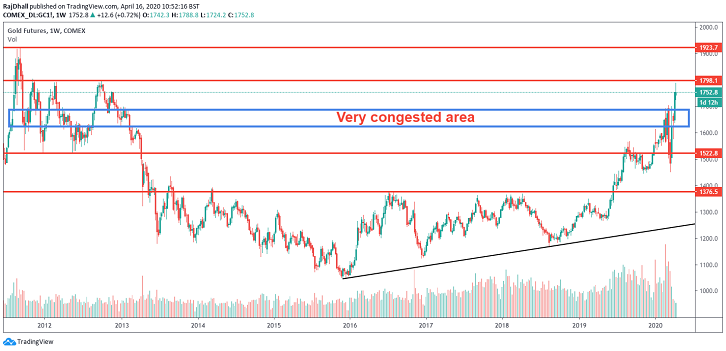
Source: TradingView Past performance is not a guide to future performance
Gold chart since June 2019
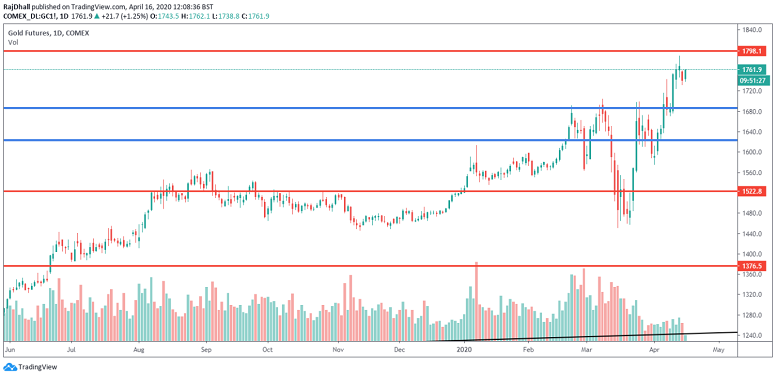
Source: TradingView Past performance is not a guide to future performance
Rajan Dhall is a freelance contributor and not a direct employee of interactive investor.
These articles are provided for information purposes only. Occasionally, an opinion about whether to buy or sell a specific investment may be provided by third parties. The content is not intended to be a personal recommendation to buy or sell any financial instrument or product, or to adopt any investment strategy as it is not provided based on an assessment of your investing knowledge and experience, your financial situation or your investment objectives. The value of your investments, and the income derived from them, may go down as well as up. You may not get back all the money that you invest. The investments referred to in this article may not be suitable for all investors, and if in doubt, an investor should seek advice from a qualified investment adviser.
Full performance can be found on the company or index summary page on the interactive investor website. Simply click on the company's or index name highlighted in the article.