Commodity watch: Expected price action for oil and copper
As the US-China trade war rages on, we look at how commodity and oil prices might behave in future.
22nd May 2019 12:02
by Rajan Dhall from interactive investor
As the US-China trade war rages on, we look at how commodity and oil prices might behave in future.

The world of commodities continues to be affected by tariffs and trade wars. Although the US-China trade war saga is turning sour, it's not all bad news as the US administration delayed the European Union (EU) auto tariffs by six months.
There was also an interesting development in the America's as the US ended tariffs on the aluminium trade with Canada, but the bad news obviously is that the US and China remain at odds on reaching a deal.
The US is now targeting companies like Chinese phones giant Huawei to flex its muscles in the negotiations. Huawei now cannot use Google maps and Youtube on its latest handsets and update the app on the older versions of their phones. China says it will retaliate with its own version of tit for tat measures, but we are yet to see any action.
Just last night we received the latest industrial production data from China, and companies do appear apprehensive about doing business with them. Chinese industrial production grew 5.4% against expectations of 6.5% and 8.5% previously.
Elsewhere, the stronger US dollar is also having an impact on the commodities complex and the dollar index hovers near seven-month highs at around the $98 region.
Beware! Oil slick
It's clear that price action on oil markets has turned bearish as the inventory levels in the US continue to rise and the Joint OPEC-non-OPEC Ministerial Monitoring Committee (JMMC) meeting gave us no real clues to what may happen at next month's OPEC meeting.
It has been said by some financial media outlets that OPEC may delay the meeting to 25th June or even the first week of July. So, what are the potential options for the cartel?
Now that the oil price is at a level where the Saudi's are comfortable ($70 per barrel in Brent crude) the issue is how they increase production back to normal levels and not flood the market with supply.
The obvious thing is to just increase by the amount that has been taken off the market by the Iranian sanction issues. The other would be to use the tensions between Iran and the US to increase production without the oil price falling too fast.
Both Russian and Saudi Arabian oil delegates have been asked recently how they plan to increase production again without damaging their efforts to rebalance the market. This is probably what the next OPEC meeting will be about, and we will only have a clearer idea about outcomes once the event has taken place.
Looking at the daily futures chart, you can see the technicals have played out nicely. The trendline retest provided a great resistance area for the West Texas Intermediate (WTI) price to bounce off and move lower (see chart below).
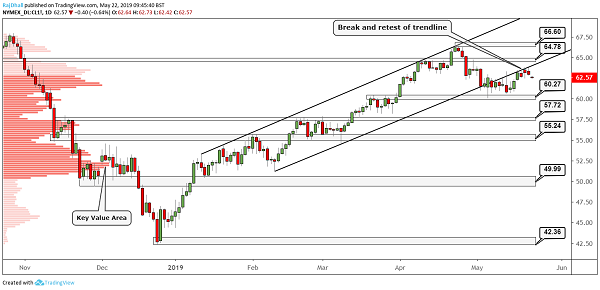
Source: TradingView Past performance is not a guide to future performance
The initial break was also retested and now it seems we are in a sideways consolidation pattern with the main support level at $60.27 per barrel. The resistance zone of $65 per barrel could hold until we get closer to the next OPEC meeting, but levels on the downside appear more important at the moment, especially as the stronger dollar still weighs on commodities.
Also, pay attention to the fact that a new lower high has been created. Now, any break of the $60.27 per barrel low would make a new lower-high lower-low trending pattern, but we must first wait for confirmation.
Copper flashes red
The weekly chart for copper below still paints a bearish picture. After flirting with $3 per pound it seems that weaker sentiment is pushing the red metal closer to the consolidation low from earlier in the year of $2.54 per pound.
Week after week the price action has been subdued as traders cannot see a clear end to the US-China negotiations, no matter how much the US administration talks up the deal on Twitter.
There are two key levels of support for copper worth keeping an eye on. The first is the upward sloping trendline originating in 2016. This level has been respected and a break of the trendline could indicate a further breakdown in prices.
The other is the $2.54 per pound support area. This level has been significant and a strong base level for months and we have not traded below it since 2017. Metals traders may find value at this level, as global demand from the likes of China and India is still quite strong and the weaker Australian dollar makes importing copper attractive.
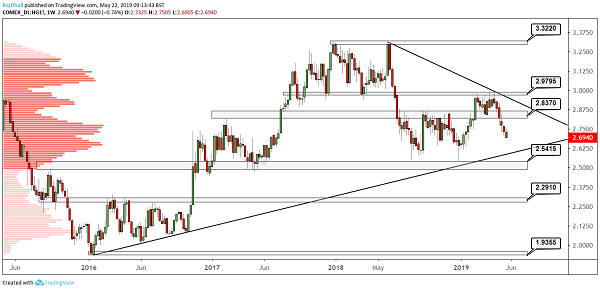
Source: TradingView Past performance is not a guide to future performance
These articles are provided for information purposes only. Occasionally, an opinion about whether to buy or sell a specific investment may be provided by third parties. The content is not intended to be a personal recommendation to buy or sell any financial instrument or product, or to adopt any investment strategy as it is not provided based on an assessment of your investing knowledge and experience, your financial situation or your investment objectives. The value of your investments, and the income derived from them, may go down as well as up. You may not get back all the money that you invest. The investments referred to in this article may not be suitable for all investors, and if in doubt, an investor should seek advice from a qualified investment adviser.
Full performance can be found on the company or index summary page on the interactive investor website. Simply click on the company's or index name highlighted in the article.