Donald Trump, Saudi Arabia and Iran: What could go wrong?
With America and Saudi possibly price-fixing and Iran agitating, we discuss prospects for oil investors.
15th May 2019 12:11
by Rajan Dhall from interactive investor
With America and Saudi possibly price-fixing and Iran agitating, we discuss prospects for oil investors.

Lots to talk about in oil markets at the moment, with crude prices pulling back from recent highs as headlines arrive thick and fast.
Big question currently is whether Donald Trump and Saudi Arabia have come to some kind of agreement on the price of oil. Is it just coincidence that the price of West Texas Intermediate (WTI) crude has been rangebound between $60 and $67 per barrel since his twitter tirades? Stable or lower oil prices would certainly reflect well on Trump as he prepares for elections in 2020.
Interestingly, over the last few days there have been reports of drone attacks on Saudi oil tankers. The Tuesday attacks - on the pumping stations around 200 miles west of Riyadh and Sunday's attacks on four tankers off Fujairah emirate – increase the threat of conflict between the United States and Iran.
With Iran the prime suspect, America says it could 'beef up' its military presence in the Gulf and send up to 120,000 troops to the region if tensions escalate.
Today we also got the latest monthly report from the International Energy Agency (IEA). In the latest report, the agency cut the demand outlook for 2019 by 90,000 barrels of oil per day (bopd) to 1.3 million barrels. The IEA also said supply may tighten due to sanctions on Iran and that production from Iran could fall to levels seen in the 1980's when the region was at war.
This report is in stark contrast to one produced by OPEC, who left its 2019 global oil demand growth forecast unchanged at 1.21 million barrels per day. It forecast a drop in supply due to issues in Iran and Venezuela. In addition, the oil cartel is expecting 2019 demand for its crude to average 30.58 million barrels per day, up 280,000 from last month.
On the daily chart below, you can see that the price has broken the lower channel trendline and retraced back toward $60 per barrel.
There is a zone of support around the $60 mark, which acted as resistance both in late March and historically. Price action at the moment is very choppy and full of indecision, but, if Iran plays ball and tensions ease, we could see prices fall further. However, in the event that tensions escalate, look for the oil price to test resistance levels on the upside (marked on the chart below).
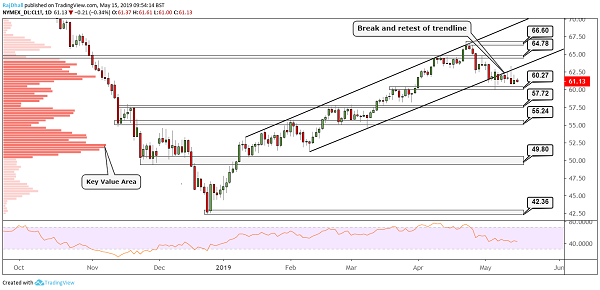
Source: TradingView Past performance is not a guide to future performance
These articles are provided for information purposes only. Occasionally, an opinion about whether to buy or sell a specific investment may be provided by third parties. The content is not intended to be a personal recommendation to buy or sell any financial instrument or product, or to adopt any investment strategy as it is not provided based on an assessment of your investing knowledge and experience, your financial situation or your investment objectives. The value of your investments, and the income derived from them, may go down as well as up. You may not get back all the money that you invest. The investments referred to in this article may not be suitable for all investors, and if in doubt, an investor should seek advice from a qualified investment adviser.
Full performance can be found on the company or index summary page on the interactive investor website. Simply click on the company's or index name highlighted in the article.