Don’t be shy, ask ii…what does total return mean?
Whether you want to find out how to start investing or how the stock market works, don’t be shy, ask ii.
20th May 2021 09:06
by Keith Bowman from interactive investor
No question is a stupid one, so whether you want to find out what you need to do to start investing or how the stock market works, don’t be shy, ask ii. Email your questions to: ask@ii.co.uk

Gail Robertson asks: when analysts talk of gains or losses made by any particular share or fund, are dividends always included in the numbers? Does everybody report on the same basis? Is it possible that some analysts will report the movement of shares inclusive of dividend income, while others might exclude it?
Keith Bowman (pictured above), Equity Analyst, interactive investor, says: there are a few methods of measuring returns generated by shares or funds, but the two which are most important to investors are price return and total return.
Price return is the simplest and most common expression of the gain or loss in a share price over a particular period, taking no account of any dividends paid.
For example, if XYZ plc’s share price rises from 100p to 110p over a 12-month period, the price return would equate to 10%.
Total return takes into account both the capital gain or loss from the share price move and any income or dividends paid during the specified period.
If the same XYZ plc share price rises from 100p to 110p over a year, and the company has paid a dividend of 5p during that time, the total return equates to the capital gain of 10p plus the income or dividend payment of 5p. That gives a total return of 15%.
Unless stated as Total Returns, price changes on financial website’s such as interactive investor’s own should be taken as Price Returns. Share prices default to Price Return, but fund prices default to Total Return.
Equities analysts and market commentators will typically refer to share price performance in their research notes unless they state otherwise. It makes sense because the price targets they set for companies are based on share price, not including dividends. Of course, dividend income may be more of a selling point for some stocks or sectors – think defensive plays such as utilities or tobacco – but this will form part of an analyst’s bull case and be expressed within the text. Growth companies are less likely to pay much of a dividend, if any at all, instead using the money to grow the business.
However, when referencing past performance, total return is a valuable way of illustrating the income-generating attributes of dividend-paying stocks, markets and other assets. Investors will use it to get a complete picture of performance over time, and compare with similar stocks, funds or sectors.
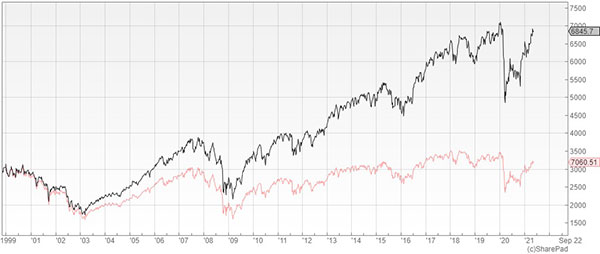
The FTSE 100 index, which has historically yielded over 4%, is a classic case in point. Look at the price chart since the dotcom peak at the end of 1999 (in red on the chart, see below) and you might be forgiven for thinking returns have been flat. But, if you factor in dividends for the total return (the black line on the chart below), the positive performance has been significant.

Fund analysts will almost always refer to total returns. You’ll see it referred to as TR in data tables and for some fund benchmark indexes such as the FTSE All Share - FTSE AllSh TR GBP. It’s a great way to compare with peers, too.
- Discover more Don't be shy, ask ii questions here
- Take control of your retirement planning with our award-winning, low-cost Self-Invested Personal Pension (SIPP)
Investment trusts quote two total return figures: one on its net asset value (NAV) performance and the other on its share price performance.
The NAV performance reflects the performance of the underlying investments held in the investment trust. When the share price is lower than the NAV per share, the trust trades at a 'discount'. Conversely, when the share price is higher than the NAV per share, the trust trades at a ‘premium’.
These articles are provided for information purposes only. Occasionally, an opinion about whether to buy or sell a specific investment may be provided by third parties. The content is not intended to be a personal recommendation to buy or sell any financial instrument or product, or to adopt any investment strategy as it is not provided based on an assessment of your investing knowledge and experience, your financial situation or your investment objectives. The value of your investments, and the income derived from them, may go down as well as up. You may not get back all the money that you invest. The investments referred to in this article may not be suitable for all investors, and if in doubt, an investor should seek advice from a qualified investment adviser.
Full performance can be found on the company or index summary page on the interactive investor website. Simply click on the company's or index name highlighted in the article.