Five things that could send stocks lower
3rd March 2023 11:01
by Luke Suddards from Finimize
Stocks have already given up half their gains for the year, and the question now is: what next?
We could see stocks slide as recent inflows from algorithm-driven investor funds and retail investors change course.
Stocks have been squeezed higher this year, from short covering, and now with positioning having become far more neutral, this sugar high might be over.
Stock valuations aren’t offering much of a cushion, with a forward price-to-earnings ratio looking lofty, around 18, and an equity risk premium looking slim, around 1.55%.
When you’re investing, it can seem like everything comes down to the Federal Reserve (Fed). And in a way, it does. The S&P 500 had a crackerjack start to the year, gaining over 6% in January when it seemed like the Fed was winning the inflation battle and therefore might be able to cool it on those interest rate hikes. But then a string of data came along to suggest the Fed could be losing. Stocks have already given up half their gains for the year, and the question now is: what next?
The answer: that’ll depend – on the Fed, sure, but also on these five factors.
1. Retail investor demand
Over the past month, retail investors have bought on average $1.51 billion of US stocks a day, setting a new record.
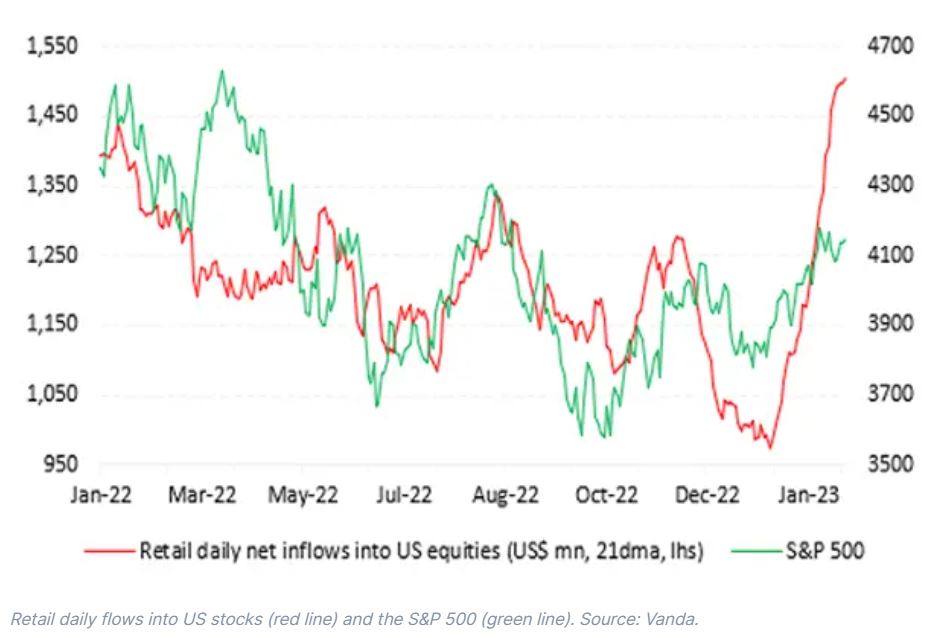
The problem is that volumes of this size will be hard to sustain going forward, meaning stocks could lose a major source of support. JPMorgan already sees signs of this happening. The bank tracks social media posts related to retail investing, and it says the number of posts tends to rise and fall along with these flows. When the number of posts dips, as it did last week, flows dip too.
What’s more, retail “call” option volume has been ticking down from its peak, the bank says, suggesting that retail investors might be becoming a bit more cautious.
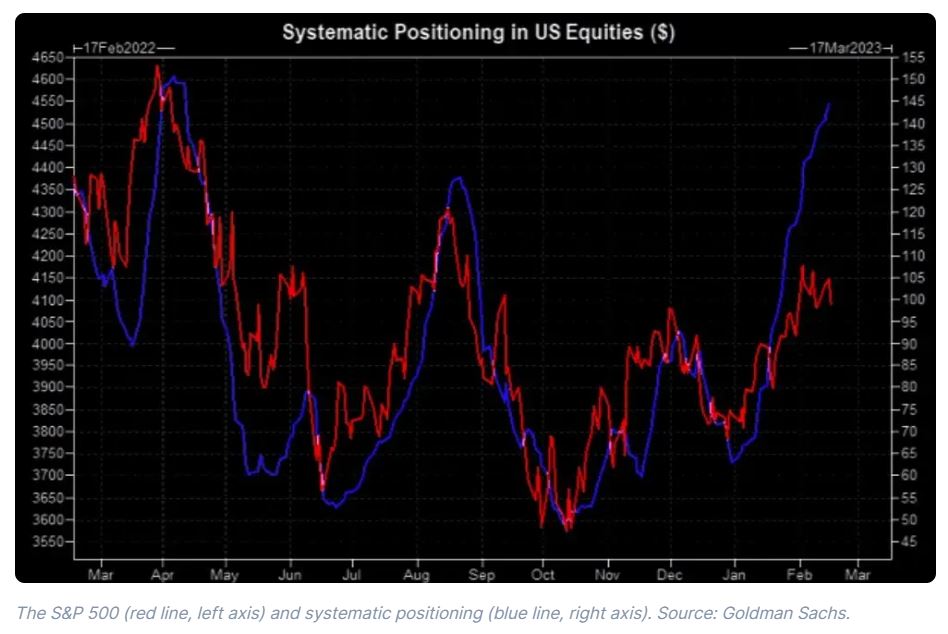
2. Flows from algorithmic traders
Systematic investors – like commodity trading advisors (CTAs) and volatility-targeting fund managers – can cause sharp swings in a stock index. These market players use algorithms to automate their investment decisions: CTAs buy and sell based on price changes, market trends, and momentum indicators; and volatility-targeting funds buy more when price volatility falls and sell when it increases. CTAs were buying massively in January and volatility funds were in on the action too as volatility declined (blue line).
With this significant and rapid buying, we’re now in a situation where stock prices could fall if these flows were to reverse. If the S&P 500 moves lower and volatility increases, selling could accelerate, triggering a chain of events that could see a hefty $46 billion of the S&P 500 sold over the next month. As of last week, Goldman Sachs was estimating that $14 billion in stocks would likely be sold by Wednesday.
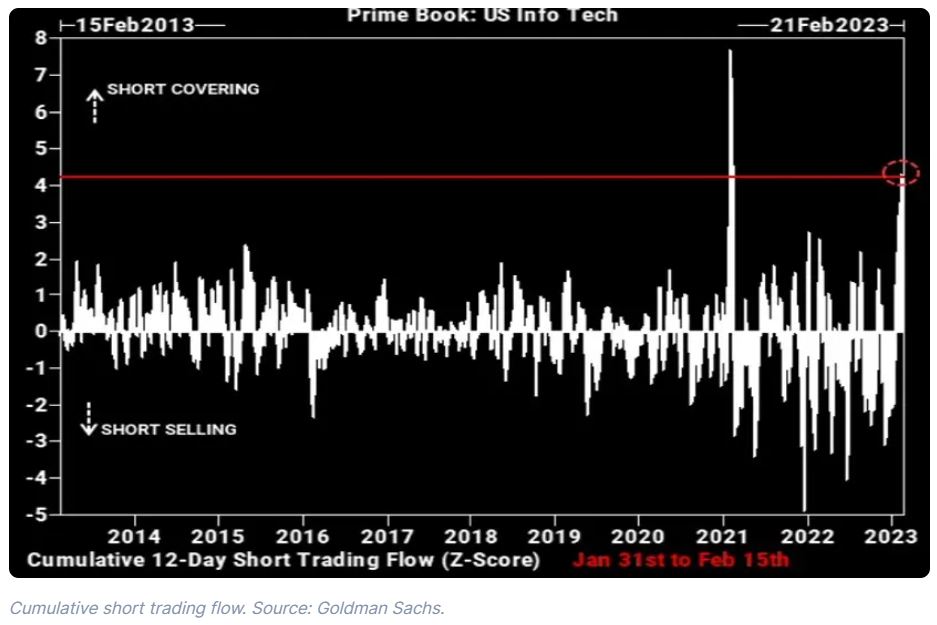
3. Shorts and other positioning
A lot of what has fueled the rally since the start of the year in stocks has been pinned on significant short covering. That’s when investors who are holding “short” positions on a stock close out their positions and buy the underlying security because the price has gone up, rather than down in line with their bets. The result is that the short covering tends to push the price of those stocks higher.
And you can see the evidence of this short covering. The strongest performance over this period has come from the lowest-quality stocks – ones that were the most oversold and heavily shorted at the end of last year.
Speculative traders are holding a lot fewer short positions now, according to recent data. In fact, their long positions outnumber their short ones. These traders – not buy-and-hold fund managers, but your more opportunistic, faster-moving players – had been holding about $119 billion in net short positions, but now are holding $14 billion in net long positions. What this tells us is that there’s no more juice for stocks from squeezing shorts, but that there is room for shorts to actually come back into the market again and pressure the S&P 500 lower.
In fact, the period from January 31 to February 15th saw the second-most short covering in US tech stocks by hedge funds in any comparable period in the past decade, putting it in the 99.5th percentile, for those keeping score.
But see, the problem with short covering is that it’s like a sugar high – it causes a short, sharp spike in stocks, but doesn’t stick around for long. Without this factor left to drive stocks higher, they’re more vulnerable to a selloff.
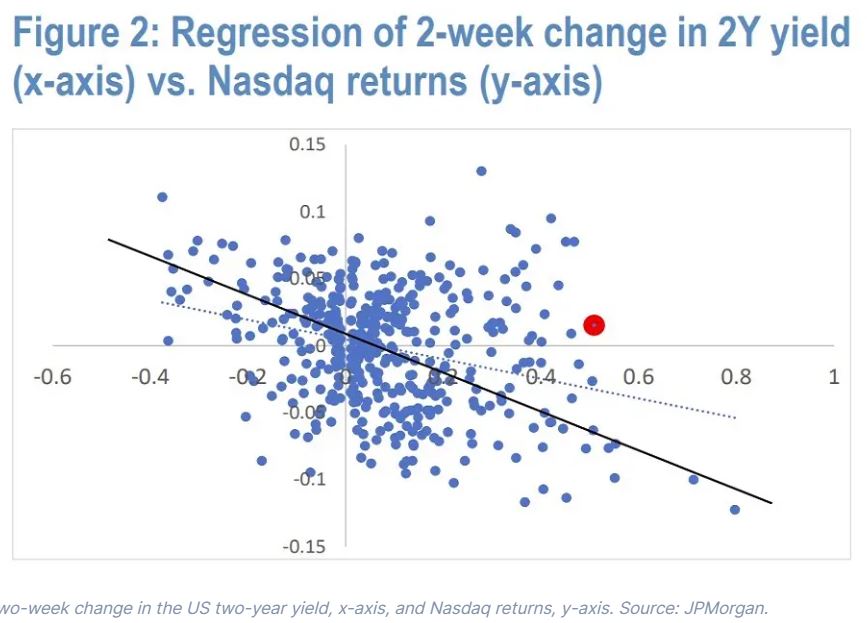
4. The link between bond yields and stocks
Typically, when yields on the two-year Treasury note rise, stocks tend to suffer, as future earnings are penalized leading to lower stock prices today. The two-year yield is also sensitive to the investor expectations around Fed interest policy – it moves lower when investors expect a pause or cut in interest rates, and moves higher when they expect more hikes. Higher rates, of course, are tougher for stocks.
However, recently this traditional relationship has broken down, with stocks instead rising in tandem with two-year US yields. To put this divergence into perspective, you’d have expected the increase in the two-year yield since the January 31st Fed meeting to have been met with a roughly 5% to 10% decline in the Nasdaq (black line), but instead, the index was up around 3% on February 15th (red dot).
JPMorgan says this relationship could revert back to its norms, with the risk-reward for bonds a lot more attractive compared to stocks, based on their respective yields. The bank also expects month-end selling by pension funds to help close the gap. What’s more, the end of March is also the end of the quarter, and Goldman has raised the possibility that pension funds might do even more selling of stocks then.
5. Not-cheap stocks
With stocks trading at around 18 times what’s expected in future earnings – i.e. its forward price-to-earnings (P/E) ratio – they’re certainly not bargains. That’s above the 80th percentile, relative to historical valuations dating back to 1976. At these levels, you could say a lot of optimism and good news has already been “priced in”, leaving little room for error. Plus, it’ll be tough for this multiple to expand with earnings on the weak side and the Fed likely to raise interest rates further and keep them higher for longer.
Still, for whatever reason, stock investors seem to be putting their fingers in their ears.
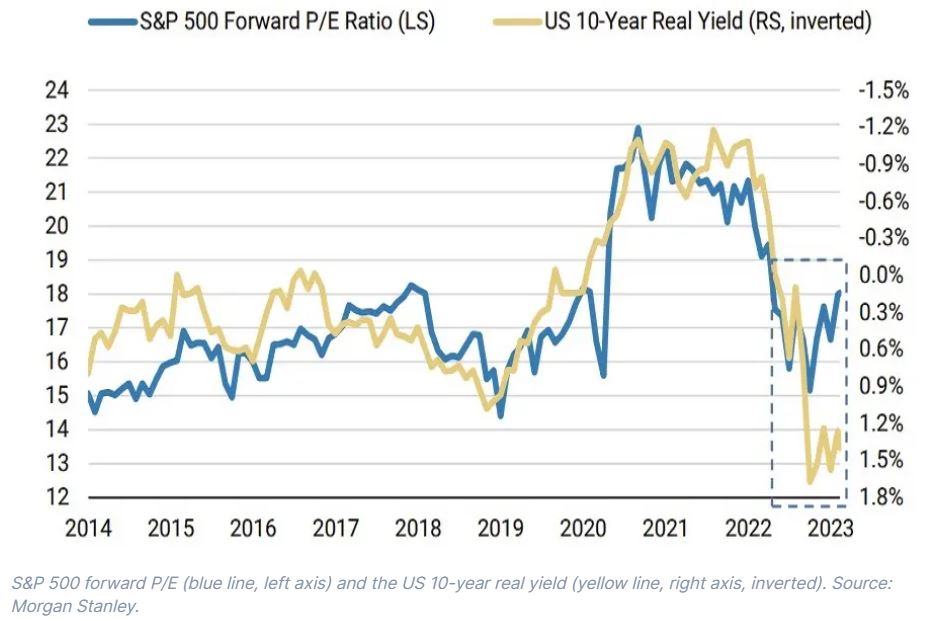
Just take a look at the wide gap between real yields on the US 10-year Treasury bond (gold line) – that is, the return that a bond investor earns from interest payments after accounting for inflation – and the S&P 500 forward P/E ratio (blue line). Now, small gaps will happen from time to time, but this crocodile jaw isn’t pretty. It suggests that one of the lines here is out of place and will need to adjust: my money’s betting it’ll be the forward P/E ratio.
Another key valuation metric is flashing a warning signal too. The equity risk premium (ERP) – that’s the extra return that investors expect from riskier stocks over safer bonds – is now at 1.55%, which Morgan Stanley deems the “death zone”. This makes the risks for stock investors high, with a very small margin of safety. If consensus earnings expectations are too high, and Morgan Stanley’s chief equity strategist believes they are, then the ERP could shrink even more.
So, in this environment, you’ll want to be cautious. Remember: stocks don’t typically reach their low before the Fed has stopped hiking – and we might have a ways yet to go until that happens…
Luke Suddards is an analyst at finimize.
ii and finimize are both part of abrdn.
finimize is a newsletter, app and community providing investing insights for individual investors.
abrdn is a global investment company that helps customers plan, save and invest for their future.
These articles are provided for information purposes only. Occasionally, an opinion about whether to buy or sell a specific investment may be provided by third parties. The content is not intended to be a personal recommendation to buy or sell any financial instrument or product, or to adopt any investment strategy as it is not provided based on an assessment of your investing knowledge and experience, your financial situation or your investment objectives. The value of your investments, and the income derived from them, may go down as well as up. You may not get back all the money that you invest. The investments referred to in this article may not be suitable for all investors, and if in doubt, an investor should seek advice from a qualified investment adviser.
Full performance can be found on the company or index summary page on the interactive investor website. Simply click on the company's or index name highlighted in the article.