FTSE 100: What happens when a downtrend is exceeded?
With the FTSE volatile, our chartist gives a great insight into analysing chart movements.
15th November 2019 09:14
by Alistair Strang from Trends and Targets
With the FTSE volatile, our chartist gives a great insight into analysing chart movements.

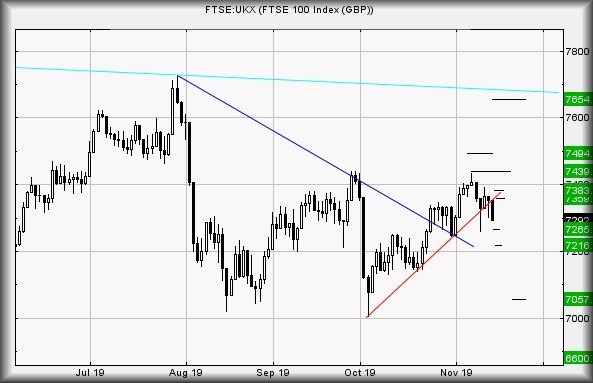
FTSE for FRIDAY (FTSE:UKX)
Optimism for the future of the FTSE 100 is gradually subsiding as the market threatens a dodgy moment, one which gives us an excuse to explain some basic rules we apply to price movements. The chart below is used to highlight something we attach importance to, what happens when a downtrend is exceeded?
Source: Trends and Targets Past performance is not a guide to future performance
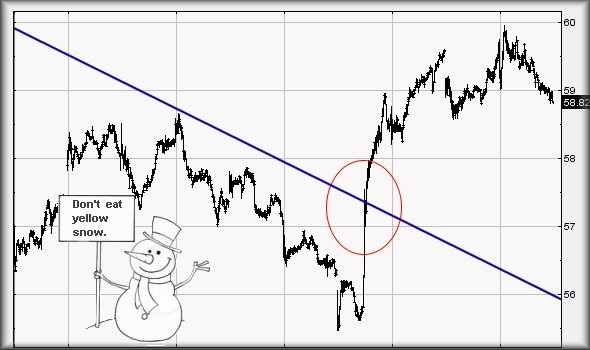
Against this particular share, the price bettered 57.34p and immediately surged upward. We've circled the movement, one which even shows a little jiggle at the point of trend break, showing the market appeared attach some importance to it.
This sort of thing is generally a "safe" signal something useful is about to happen. In this particular instance, it had an initial target of 59.5p, achieved and slightly bettered.
In theory, this gives hope for the future but we've circled the trend break of 57.34p to highlight something else. If a share (or index) manages below the point of trend break, following an initial surge, the implication for any immediate growth is really not great.
Instead, there's a strong probability a price is about to mess around, usually between the high achieved following the trend break and the low achieved before the trend break.
We've absolutely no idea why this should happen but in the case of this particular share, it suggests anything now below 57.34p will doubtless witness the share price oscillate between 55.5p and 59.5p for a while.
Obviously, a useful trading range and only when this range is either exceeded or broken dare we believe a new trend is forming.
With the looming general election, we suspect quite a few shares shall be placed in a parking zone until it becomes clear the UK knows what isn't going to happen next...
The reason we explained the foregoing is twofold. Firstly, 'cos we've nothing interesting to write about the FTSE 100 and secondly, 'cos the FTSE 100 is in danger of doing exactly the thing we're warning about.
If the market closes below 7,280 points, it shall exhibit a very real risk of becoming rangebound for a while until the UK political shambles is resolved. This will mean the market being trapped in the 7,140 to 7,400 zone for a while.
Near term, the suggestion is of weakness now below 7,288 bringing reversal down to an initial 7,266 points. If broken, our secondary calculation comes in at a less likely (near term) 7,216 points.
There is a surprising, alternate potential for Friday. In the event the index makes it above 7,331 points, some recovery to an initial 7,359 is possible. If bettered, secondary calculates at 7,383 points.
We suspect reversal but on the bright side, despite Brazil not appearing on our list of countries visiting our website, São Paulo hosts this weekends Formula 1 race.
Source: Trends and Targets Past performance is not a guide to future performance
Alistair Strang has led high-profile and "top secret" software projects since the late 1970s and won the original John Logie Baird Award for inventors and innovators. After the financial crash, he wanted to know "how it worked" with a view to mimicking existing trading formulas and predicting what was coming next. His results speak for themselves as he continually refines the methodology.
Alistair Strang is a freelance contributor and not a direct employee of Interactive Investor. All correspondence is with Alistair Strang, who for these purposes is deemed a third-party supplier. Buying, selling and investing in shares is not without risk. Market and company movement will affect your performance and you may get back less than you invest. Neither Alistair Strang or Interactive Investor will be responsible for any losses that may be incurred as a result of following a trading idea.
These articles are provided for information purposes only. Occasionally, an opinion about whether to buy or sell a specific investment may be provided by third parties. The content is not intended to be a personal recommendation to buy or sell any financial instrument or product, or to adopt any investment strategy as it is not provided based on an assessment of your investing knowledge and experience, your financial situation or your investment objectives. The value of your investments, and the income derived from them, may go down as well as up. You may not get back all the money that you invest. The investments referred to in this article may not be suitable for all investors, and if in doubt, an investor should seek advice from a qualified investment adviser.
Full performance can be found on the company or index summary page on the interactive investor website. Simply click on the company's or index name highlighted in the article.