FTSE 100: What we can learn from historical lows
Market volatility at present is proving 'interesting'. Our chartist looks at would could happen next.
16th March 2020 10:55
by Alistair Strang from Trends and Targets
Market volatility at present is proving 'interesting'. Our chartist looks at would could happen next.

Market volatility at present is proving 'interesting', goal posts rapidly shuffling around as the media enhances every Covid-19 scare story, opting to bury anything which fails to meet their immediate narrative. However, the pace of descent showing on the FTSE 100 is perhaps of greater concern than anything else.
We've never seen this sort of thing against a major index. While, historically, there have been many major drops, the unrelenting downward pressure is of an entirely new magnitude, the level of downward acceleration perhaps reflecting the speed of computers when left to their own devices!
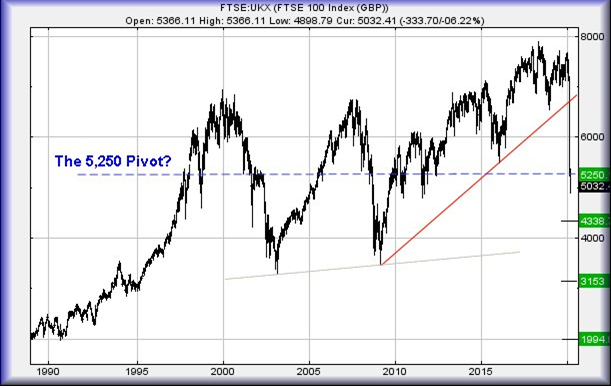
The 5,250-point level was a pretty big deal for us. We'd hoped to witness a rebound at such a point, the FTSE opting to ignore our opinion and instead dive 450 points further.
We suspect the market shall recover to the 5,250 level anyway, probably oscillating above and below for a while until sufficient excuse is given to enact a further hammering. This (somewhat tenuous) theory is built on nothing more than the pace of descent, along with an expectation the market shall take a breath before the next phase.
Historically, even the FTSE drop associated with 'Hong Kong Flu' in 1969 was to take around a year to read bottom. In this instance, the market reversed by around 37%. Closer to present, and with the markets started to be driven by software, the "Tech Drop" of 2003 experienced reversal of over 50%, taking 30 months to occur. The banking sectors contribution to market misery in 2009 started in 2007, taking 18th months to find bottom after a reversal of almost 50%.
So far, the FTSE has reversed by 34% in less than a month!
Despite our expectation of 5,250 providing a pivot level, the break below forces us to expect the worst, a story of misery which could have been penned by Charles Dickens...
Weakness next below 4,890 points carries the threat of reversal to an initial 4,338 points. If, or rather when, broken, our secondary calculates at a market bottom of 3,153 points.
This market bottom is a serious problem, suggesting a reversal of 60% and taking the UK index into the Land of Lower Lows. The addition of this factor is dangerous, permitted a calculation of 1,994 points as "Ultimate Bottom", a number last seen 30 years ago.
At time of writing, to even break the speed of descent, the FTSE needs to exceed 5,650 points. We're not holding our breath, only when we pass within three feet of another human.
Source: Trends and Targets Past performance is not a guide to future performance
Alistair Strang has led high-profile and "top secret" software projects since the late 1970s and won the original John Logie Baird Award for inventors and innovators. After the financial crash, he wanted to know "how it worked" with a view to mimicking existing trading formulas and predicting what was coming next. His results speak for themselves as he continually refines the methodology.
Alistair Strang is a freelance contributor and not a direct employee of Interactive Investor. All correspondence is with Alistair Strang, who for these purposes is deemed a third-party supplier. Buying, selling and investing in shares is not without risk. Market and company movement will affect your performance and you may get back less than you invest. Neither Alistair Strang, or interactive investor will be responsible for any losses that may be incurred as a result of following a trading idea.
Alistair Strang has led high-profile and "top secret" software projects since the late 1970s and won the original John Logie Baird Award for inventors and innovators. After the financial crash, he wanted to know "how it worked" with a view to mimicking existing trading formulas and predicting what was coming next. His results speak for themselves as he continually refines the methodology.
Alistair Strang is a freelance contributor and not a direct employee of Interactive Investor. All correspondence is with Alistair Strang, who for these purposes is deemed a third-party supplier. Buying, selling and investing in shares is not without risk. Market and company movement will affect your performance and you may get back less than you invest. Neither Alistair Strang or Interactive Investor will be responsible for any losses that may be incurred as a result of following a trading idea.
These articles are provided for information purposes only. Occasionally, an opinion about whether to buy or sell a specific investment may be provided by third parties. The content is not intended to be a personal recommendation to buy or sell any financial instrument or product, or to adopt any investment strategy as it is not provided based on an assessment of your investing knowledge and experience, your financial situation or your investment objectives. The value of your investments, and the income derived from them, may go down as well as up. You may not get back all the money that you invest. The investments referred to in this article may not be suitable for all investors, and if in doubt, an investor should seek advice from a qualified investment adviser.
Full performance can be found on the company or index summary page on the interactive investor website. Simply click on the company's or index name highlighted in the article.