FTSE for Friday: after 10% rally, can UK shares rise even further?
11th November 2022 07:34
by Alistair Strang from Trends and Targets
UK shares have soared over the past month, the latest leg of the rally in response to US inflation data. Independent analyst Alistair Strang reveals what his charts say could happen next.

It remains extremely possible the markets, thankfully including the UK, are continuing to exhibit signs of a rally.
Unheard of numbers from the USA made themselves apparent on Thursday with the Nasdaq up 7.5%, the S&P 500 up 5.5%, and sober Wall Street climbing by 3.7%.
In Europe, the FTSE managed 1.1%, pretty pathetic when viewed against Germany at plus 3.5% and the Euro Stoxx 50 also up by 3.2%. However, the UK index did close Thursday's session 10% higher than the 13 October intraday low at 6,707.
- Find out about: Trading Account | Share prices today | Top UK shares
All this largess was blamed on better-than-expected US inflation figures, and it looks very much like this positive behaviour shall continue, hopefully until the Nasdaq attains around 12,400 points, while the DAX admires the scenery around 14,900 points.
Even Wall Street presents a strong argument favouring a path to an eventual 36,100 points before some serious hesitation is expected. All things considered, it’s probably the case that politicians now feel primed to say or do something exceptionally stupid.
We’ve mentioned repeatedly the phenomena of shares or indices behaving strongly when they exceed the level of a prior break of a major trend. It’d be naive to think the gains are anything to do with charts themselves. Instead, it must be remembered that all a chart is measuring is the level of confidence from investors. This particular chart signal is pretty important, giving a solid clue of assurance and spirit coming back into the marketplace.
Or perhaps it’s just the case that folk in the UK are getting fed up with the revolving door in Downing Street and seeking light relief elsewhere.
- Stock markets rocket after shock US inflation data
- This US midterm election investing trick has worked 100% of the time
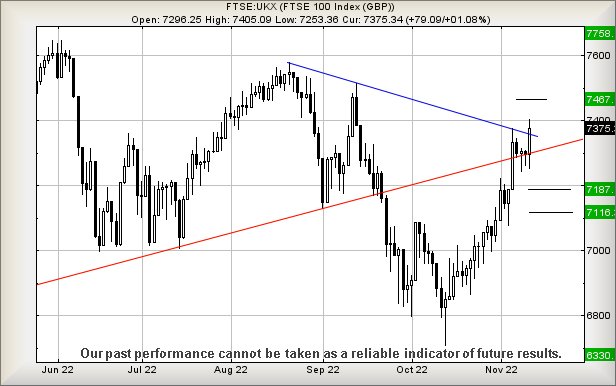
For the FTSE 100, our previous Big Picture potential remains at 7,467 points, an ambition which is obviously very close to the current market level. We still suspect the index shall experience some hesitation at such a point.
Near term, movement above 7,406 points calculates with the potential of a lift to 7,465 points, effectively hitting our Big Picture target mooted a week ago. We can give a secondary, calculating at an astounding 7,756 points. Normally, we’d cheerfully ridicule such an ambition for a single day but, given market strengths elsewhere, who knows?

Past performance is not a guide to future performance
Maybe the FTSE shall produce a little miracle. Currently the FTSE 100 needs to slither below 7,300 to rain on the parade, a wide stop loss level but we’d prefer it wider at 7,250 points!
Our converse scenario, should the FTSE manage to wander below 7,285 points, risks pushing reversal to an initial 7,187 points with secondary, if broken, at 7,116 points. At time of writing, absolutely nothing suggests such a calamity.
Alistair Strang has led high-profile and "top secret" software projects since the late 1970s and won the original John Logie Baird Award for inventors and innovators. After the financial crash, he wanted to know "how it worked" with a view to mimicking existing trading formulas and predicting what was coming next. His results speak for themselves as he continually refines the methodology.
Alistair Strang is a freelance contributor and not a direct employee of Interactive Investor. All correspondence is with Alistair Strang, who for these purposes is deemed a third-party supplier. Buying, selling and investing in shares is not without risk. Market and company movement will affect your performance and you may get back less than you invest. Neither Alistair Strang or Interactive Investor will be responsible for any losses that may be incurred as a result of following a trading idea.
These articles are provided for information purposes only. Occasionally, an opinion about whether to buy or sell a specific investment may be provided by third parties. The content is not intended to be a personal recommendation to buy or sell any financial instrument or product, or to adopt any investment strategy as it is not provided based on an assessment of your investing knowledge and experience, your financial situation or your investment objectives. The value of your investments, and the income derived from them, may go down as well as up. You may not get back all the money that you invest. The investments referred to in this article may not be suitable for all investors, and if in doubt, an investor should seek advice from a qualified investment adviser.
Full performance can be found on the company or index summary page on the interactive investor website. Simply click on the company's or index name highlighted in the article.