FTSE for Friday: after a record week it's all eyes on 9,000 for FTSE 100
After making record highs this week, the charts point to significant long-term potential for the FTSE 100. Independent analyst Alistair Strang thinks the index has ticked some pretty big boxes.
26th April 2024 07:36
by Alistair Strang from Trends and Targets

There’s nothing like a seriously big picture glance at a chart to throw a bucket of cold water on expectations. Surprisingly, for the FTSE 100, this isn’t the case as the share price has now closed higher, achieved a higher intraday value, than at any point ever.
In fact, from the perspective of most of hour rules we’d be churlish to dodge optimism as the market value now also exceeds pre-pandemic levels.
- Invest with ii: Open a Stocks & Shares ISA | ISA Investment Ideas | Transfer a Stocks & Shares ISA
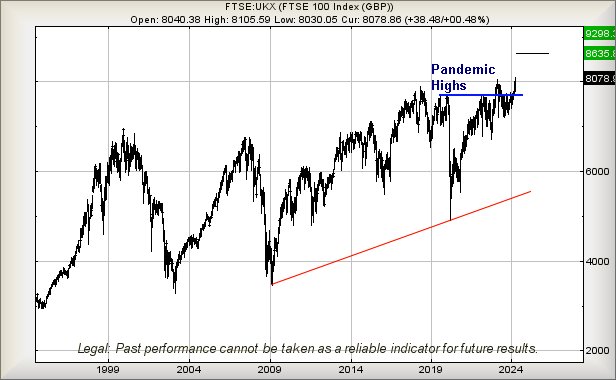
There is certainly plenty of reason to pause for thought with the immediate chart below. From 2003 until 2007, people everywhere were delighted at the FTSE recovery from the Tech crash of 2003 but, literally, from every perspective, the FTSE failed to provide final confirmation of happy days continuing, when during 2007 it utterly failed to register higher highs of any type.
Everyone knows what happened thereafter, the financial crash of 2008/09 meeting the criteria for a market “Double Bottom”.
Thus, we now find ourselves in a surprising situation, the FTSE 100 having ticked some pretty important boxes which allow optimism for the longer term. Those of a sceptical disposition should skip the next bit, due to the Big Picture offering some quite fanciful strength.
Apparently, the FTSE 100 can now be viewed as heading toward an initial 8,635 points with our secondary, if bettered, an amazing 9,298 points. Obviously, this is from a long-term standpoint, the FTSE needing below 7,517 points to utterly cancel our calculations. From the point of view of constituents of the FTSE, hopefully this is an indication some of the sectors languishing in the gutter are about to try for a day in the sun.

Source: Trends and Targets. Past performance is not a guide to future performance.
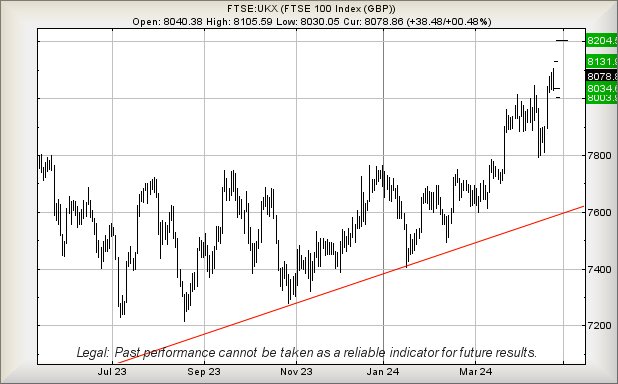
From a near-term perspective the FTSE 100 is simply strange. Since 22 April, the index has been refusing to make “proper” movements, mucking around with multiple fits and starts, only to be hammered back into place as each day continues.
Thankfully, behaviour has got to the point where above just 8,106 points should trigger movement next to an initial 8,131 points with our secondary, if beaten, a surprisingly smug looking 8,204 points. Should such a miracle occur, our tightest stop looks like 8,058 points.
Our converse scenario suggests weakness below 8,058 risks a trip down to 8,034 points. If broken, our secondary works out at 8,003 points and a possible bounce.

Source: Trends and Targets. Past performance is not a guide to future performance.
Alistair Strang has led high-profile and "top secret" software projects since the late 1970s and won the original John Logie Baird Award for inventors and innovators. After the financial crash, he wanted to know "how it worked" with a view to mimicking existing trading formulas and predicting what was coming next. His results speak for themselves as he continually refines the methodology.
Alistair Strang is a freelance contributor and not a direct employee of Interactive Investor. All correspondence is with Alistair Strang, who for these purposes is deemed a third-party supplier. Buying, selling and investing in shares is not without risk. Market and company movement will affect your performance and you may get back less than you invest. Neither Alistair Strang or Interactive Investor will be responsible for any losses that may be incurred as a result of following a trading idea.
These articles are provided for information purposes only. Occasionally, an opinion about whether to buy or sell a specific investment may be provided by third parties. The content is not intended to be a personal recommendation to buy or sell any financial instrument or product, or to adopt any investment strategy as it is not provided based on an assessment of your investing knowledge and experience, your financial situation or your investment objectives. The value of your investments, and the income derived from them, may go down as well as up. You may not get back all the money that you invest. The investments referred to in this article may not be suitable for all investors, and if in doubt, an investor should seek advice from a qualified investment adviser.
Full performance can be found on the company or index summary page on the interactive investor website. Simply click on the company's or index name highlighted in the article.