FTSE for Friday: a good indicator of future for FTSE 100 and bitcoin
24th June 2022 07:59
by Alistair Strang from Trends and Targets
Market behaviour can be confusing, so independent analyst Alistair Strang uses a favoured technique to try and predict what might happen next.
Increasingly, we’re seeing market behaviour which is tending to prove a ‘safe’ indicator of future behaviour. Obviously, like any visual indicator, the “gotcha” cannot be regarded as 100% reliable but currently, both the FTSE and bitcoin appear to be prepping themselves to once again trap traders.
Bitcoin
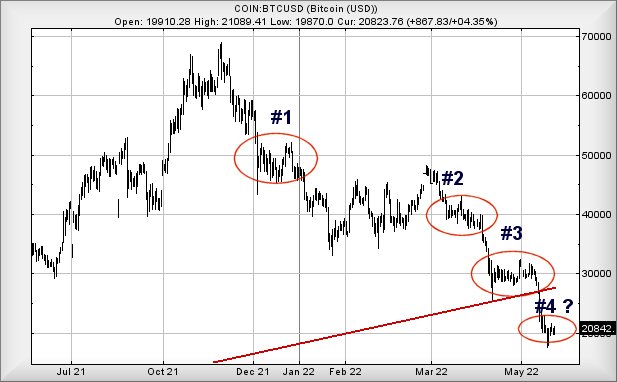
The bitcoin chart below is fairly simple.
Back in December last year, #1 delineates a period where “everyone” finally concluded bitcoin wasn’t going to fall far below $50,000. Suddenly, “gotcha”.
In March this year, #2 shows a period where the market conspired to give a solid impression $40,000 was a solid floor. Once again, “gotcha”.
Then came April/May, period #3 with an even longer period absolutely convincing everyone bitcoin had finally bottomed at $30,000. Oops and another “gotcha”.
Finally, it feels like bitcoin is starting period #4, a visually assuring picture of bitcoin finally stopping falling at $20,000 and just 29% of its high in 2021. Obviously, there’s no way bitcoin is going to fall further… is there?
Past performance is not a guide to future performance.
This market behaviour, a price essentially flatlining for a while, increasingly feels contrived and designed to create a situation where a large number of traders convince themselves a trade is “safe”. Often, during the relative flat period, there will be contradictory movements and in a falling market, these comprise short lived nudges upwards.
When this sort of nonsense occurs, we generally insist on hard proof market direction has changed. In the case of bitcoin, this is a demand the value exceed $28,000, the level of the most recent Red trend break.
Importantly, the converse also proves remarkably reliable. When a price starts to flatline in a rising market, it often feels this is designed to get folk to off-load positions as they convince themselves a price is going to higher. Virtually every trader has a tale to tell of selling (in profit), only to miss the real substantial rise.
FTSE 100
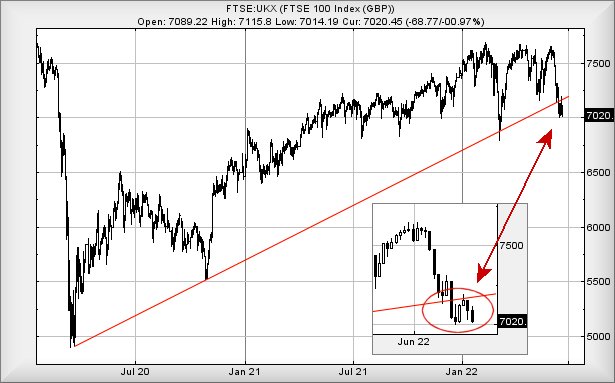
For the FTSE 100, the most recent five trading sessions appear contrived to convince the market the FTSE has a floor of 7,000 points.
The index broke through the uptrend since 2020, fell to 7,000 and stopped falling. We should obviously all rush out and take Long positions with a Stop just below 7,000 as the FTSE has obviously discovered a floor level. We’ve a little problem with this behaviour as it’s vanishingly rare for an item to break such an uptrend, then completely stop falling.
Instead, we suspect the market is preparing a “gotcha” scenario, the FTSE needing above 7,160 points to give us a reasonable first indication a further drop should not be anticipated.
Curiously, when we examine other markets, Wall Street remains in a “gotcha” position whereas the Nasdaq has now given the first suggestion a severe reversal should not be anticipated. Hopefully the next few session should provide clarity while the world decides what it wants to do. Perhaps the Nasdaq is an early indicator the wildly mooted stock market recession is perhaps not currently scheduled.
Past performance is not a guide to future performance.
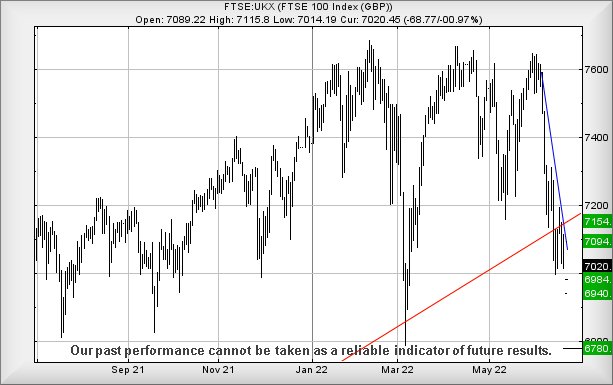
As for the FTSE, near term (trading around 7,022 at time of writing), below 7,014 looks problematic as reversal to an initial 6,984 calculates as possible. Our secondary, should such a level break, works out at 6,940 points, along with a probable bounce.
For an alternate scenario above 7,075 looks mildly interesting, allowing an initial 7,094 points with secondary, if exceeded, a rather more useful 7,154 points, almost the level above which our Big Picture drop scenario becomes invalid.
Past performance is not a guide to future performance.
Alistair Strang has led high-profile and "top secret" software projects since the late 1970s and won the original John Logie Baird Award for inventors and innovators. After the financial crash, he wanted to know "how it worked" with a view to mimicking existing trading formulas and predicting what was coming next. His results speak for themselves as he continually refines the methodology.
Alistair Strang is a freelance contributor and not a direct employee of Interactive Investor. All correspondence is with Alistair Strang, who for these purposes is deemed a third-party supplier. Buying, selling and investing in shares is not without risk. Market and company movement will affect your performance and you may get back less than you invest. Neither Alistair Strang or Interactive Investor will be responsible for any losses that may be incurred as a result of following a trading idea.
These articles are provided for information purposes only. Occasionally, an opinion about whether to buy or sell a specific investment may be provided by third parties. The content is not intended to be a personal recommendation to buy or sell any financial instrument or product, or to adopt any investment strategy as it is not provided based on an assessment of your investing knowledge and experience, your financial situation or your investment objectives. The value of your investments, and the income derived from them, may go down as well as up. You may not get back all the money that you invest. The investments referred to in this article may not be suitable for all investors, and if in doubt, an investor should seek advice from a qualified investment adviser.
Full performance can be found on the company or index summary page on the interactive investor website. Simply click on the company's or index name highlighted in the article.