The future for Barclays shares
With banks out of favour, could this lender challenge the lows of the financial sector crash in 2009?
7th September 2020 09:26
by Alistair Strang from Trends and Targets
With bank stocks out of favour, could this lender challenge the lows of the financial sector crash in 2009?
At the risk of sounding like a Christmas cracker, we’re returning to our favourite “When is a Trend not a Trend?” subject, especially as the retail banks continue to prove neither uptrends nor downtrends dare be trusted.
Barclays (LSE:BARC) has delivered a perfect ‘case in point’, with recent price movements tending to rubbish any immediate notion as to what’s actually going on!
The illustrations below deal with two recent Barclays scenario, where both the uptrend and downtrend lied. We’ve a fairly big rule in-house about the price level when a share price breaks trend.
Basically, this is the point when you no longer dare assume a share price intends move in whatever direction is suggested. In the case of “When the uptrend tells lies”, it’s pretty straightforward as Barclays share price broke trend at 105p. This carried the immediate threat of some true reversals about to occur.
However, the very next day, the share price recovered above the trend and this suggests only one thing. The red line on the chart, the uptrend since March, was incorrect as the market isn’t really paying any attention to it.
What’s the solution?
Redraw the line, adjusting the bottom level against the recent low. It now implies Barclays must next trade below 104p before raising an eyebrow. We prefer a more logical approach, demanding the share trade below the previous trend break low before panic, in this case insisting on 103p breaking before becoming pretty certain some reversals are really coming. More on this below.
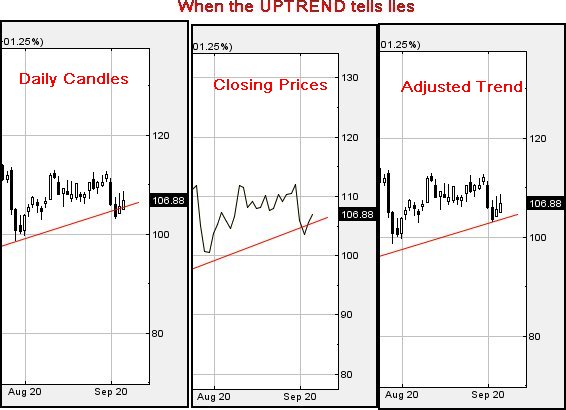
Source: Trends and Targets Past performance is not a guide to future performance
Equally, there’s the ‘blue’ downtrend, again the source of recent trend malpractice with Barclays.
This particular line since June really looked convincing, suggesting the share price needed to break 110p to provide a convincing break of the trend. Folk who read our last analysis from mid-August would be aware, we’d demanded the price really needed better 114p to be taken seriously as we already distrusted the downtrend.
This proved to be the case, the share price managing to break trend and soar, uselessly, to 112.7p before once again retreating below the blue line on the chart. It was clear the downtrend did not merit any level of trust, so we adjusted it. Barclays now needs to exceed 112p to break above trend. Unfortunately, this is just a box ticking exercise as our software now demand the share price exceeds 117.5p before we dare suspect moves have any integrity.
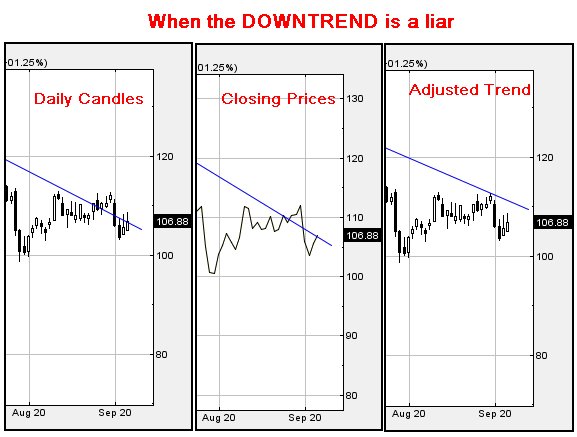
Source: Trends and Targets Past performance is not a guide to future performance
Finally, we can move to our immediate thoughts for the Barclays share price.
Above 117.5p should now prove capable of a lift to an initial 120.5p with secondary, if exceeded, a rather more useful looking 125p. Our interest in the 125p target level is piqued due to this potentially allowing the price to close above a series of previous highs in July, potentially creating a higher-high situation which will signal some proper price recovery toward 142p.
The flip side of the coin comes with the 103p level as mentioned in our opening paragraphs. Movement below this level now risks triggering reversal to an initial 95p with secondary, when (or if) broken at 85p and hopefully a rebound.
The implications below 85p are quite difficult to believe, challenging the lows of the financial sector crash from 2009.
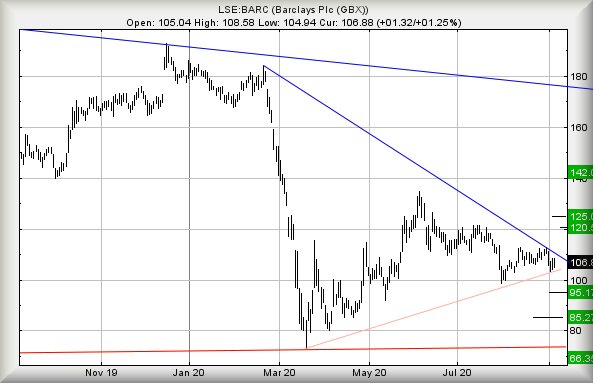
Source: Trends and Targets Past performance is not a guide to future performance
Alistair Strang has led high-profile and "top secret" software projects since the late 1970s and won the original John Logie Baird Award for inventors and innovators. After the financial crash, he wanted to know "how it worked" with a view to mimicking existing trading formulas and predicting what was coming next. His results speak for themselves as he continually refines the methodology.
Alistair Strang is a freelance contributor and not a direct employee of Interactive Investor. All correspondence is with Alistair Strang, who for these purposes is deemed a third-party supplier. Buying, selling and investing in shares is not without risk. Market and company movement will affect your performance and you may get back less than you invest. Neither Alistair Strang or Interactive Investor will be responsible for any losses that may be incurred as a result of following a trading idea.
These articles are provided for information purposes only. Occasionally, an opinion about whether to buy or sell a specific investment may be provided by third parties. The content is not intended to be a personal recommendation to buy or sell any financial instrument or product, or to adopt any investment strategy as it is not provided based on an assessment of your investing knowledge and experience, your financial situation or your investment objectives. The value of your investments, and the income derived from them, may go down as well as up. You may not get back all the money that you invest. The investments referred to in this article may not be suitable for all investors, and if in doubt, an investor should seek advice from a qualified investment adviser.
Full performance can be found on the company or index summary page on the interactive investor website. Simply click on the company's or index name highlighted in the article.