The future for easyJet, plus a stock market theory
4th October 2022 07:23
by Alistair Strang from Trends and Targets
Independent analyst Alistair Strang shares his theory on stock market performance and also issues an update for easyJet.

There’s a constant rumble in the media suggesting market reversals are upon us, but the table below illuminates something quite odd.
Taking the Nasdaq tech index as a case in point, from 2020’s pre-pandemic high, it rose from 9,740 points up to 16,740 points, an impressive rise of 41%. But since the start of 2022, it has fallen to a recent low of 10,970 points, -33% from this years high.
- Find out about: Trading Account | Share prices today | Top UK shares
We’ve a sneaking suspicion indices are all intending to settle around their pre-pandemic level, perhaps making an attempt at some stability.
| 2022’s % gain from pre-Covid 2020 | % drop from 2022 high | |
| Nasdaq | 41% | -33% |
| S&P 500 | 29% | -25% |
| Wall Street | 22% | -22% |
| FTSE 100 | 1% | -11% |
| DAX | 15% | -13% |
| Euro Stoxx | 12% | -26% |
| UK Crude | 48% | -40% |
It was interesting that the Dow Jones on Monday 3 October celebrated being up 22% since 2020, then down 22% from its high, and experienced a day with gains sometimes over 3%. The market is now marginally below the pre-pandemic level (29,550 points) and we’re curious if we’re about to witness some surprise gains on some markets.
Obviously, the Euro Stoxx 50 is a bit of an outlier in this theory, as is the FTSE 100 but, for the FTSE, we’ve got local politicians attempting to destroy the country while they enact their versions of “a cunning plan”.
The above is certainly food for thought. We believe, should the Dow exceed 30,050 points anytime soon, threats of market collapse shall prove unfounded.
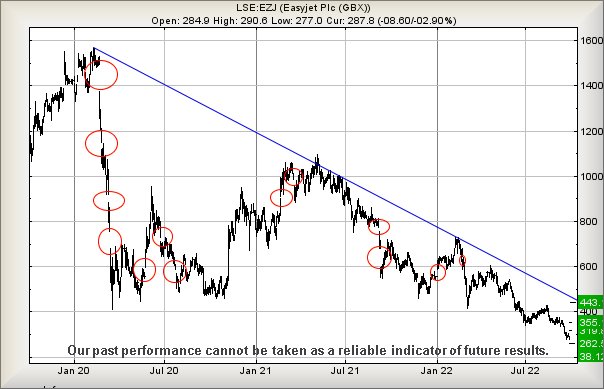
Giving easyJet shares a safety check
As for easyJet (LSE:EZJ), when we last reviewed the share price, we’d provided a drop target level at 334p. The share decided to play fair, dropping to our target level and successfully respecting it for a few months until mid-September, when on the 22nd of the month, the share was literally gapped down below our 334p level.
This tended to prove we’d been monitoring the correct trend but made us wonder what the market was up to. Our secondary, below 334p, had been given as a silly looking 38p, a target we still have considerable difficulty in taking seriously.
If our suspicion is correct from our examination of market numbers above, perhaps easyJet may be due a surprise era of price recovery. The immediate situation calculates with the potential of weakness below 277p being capable of 262p and hopefully a bounce. But we do need to concede the share price is trading in a region where ultimate bottom remains at our silly 38p.
Past performance is not a guide to future performance
Examining the other side of the coin, if a surprise recovery is indeed on the cards, above 292p theoretically should provoke an attempt at 319p initially with secondary, if bettered, a rather more encouraging 355p, along with a heightened visual chance of some hesitation.
We’d certainly wish to revisit the numbers at such a level, easyJet needing share price closure above 355p to suggest game changing longer term potentials.
Alistair Strang has led high-profile and "top secret" software projects since the late 1970s and won the original John Logie Baird Award for inventors and innovators. After the financial crash, he wanted to know "how it worked" with a view to mimicking existing trading formulas and predicting what was coming next. His results speak for themselves as he continually refines the methodology.
Alistair Strang is a freelance contributor and not a direct employee of Interactive Investor. All correspondence is with Alistair Strang, who for these purposes is deemed a third-party supplier. Buying, selling and investing in shares is not without risk. Market and company movement will affect your performance and you may get back less than you invest. Neither Alistair Strang or Interactive Investor will be responsible for any losses that may be incurred as a result of following a trading idea.
These articles are provided for information purposes only. Occasionally, an opinion about whether to buy or sell a specific investment may be provided by third parties. The content is not intended to be a personal recommendation to buy or sell any financial instrument or product, or to adopt any investment strategy as it is not provided based on an assessment of your investing knowledge and experience, your financial situation or your investment objectives. The value of your investments, and the income derived from them, may go down as well as up. You may not get back all the money that you invest. The investments referred to in this article may not be suitable for all investors, and if in doubt, an investor should seek advice from a qualified investment adviser.
Full performance can be found on the company or index summary page on the interactive investor website. Simply click on the company's or index name highlighted in the article.