Global liquidity is at a record high – here’s where that money could move next
Global liquidity is at an all-time high, and Jonathan Hobbs thinks one investment could soon hoard a lot of that cash.
13th June 2025 09:04
by Jonathan Hobbs from Finimize

Global liquidity is rising fast – according to the Global Liquidity Index, which keeps recording fresh all-time highs.
- Over the past few years, that money has flowed into investments like gold, stocks, and bitcoin
- Long-dated US Treasury bonds haven’t received much of the cash over the last few years – but they could be exactly where liquidity lands next.
You might’ve heard about an indicator called the Global Liquidity Index (GLI). As the name suggests, investors use it to gauge the amount of liquidity flowing through the economy (and hence, the markets). Well, the GLI has been pushing higher all year – in fact, it just reached a new record high. Now, plenty of that cash could flow into different investments. And with many of the go-to hiding spots looking full to the brim, I’ve found one asset that might be next in line.
How does this Global Liquidity Index work, then?
The Global Liquidity Index (GLI) essentially measures the total amount of money circulating through the global financial system. The higher the number, the more liquid the economy, according to the indicator. To reach a figure, it tallies up data from major central banks' balance sheets, money supply metrics like M2 (measuring the amount of money held in cash and easily accessible accounts), and key US liquidity accounts like the Treasury General Account (TGA) and Reverse Repurchase Agreements (RRP).
The version I’m using in the chart below shows GLI’s movement since 2020. It covers major central banks from the US, Europe, China, Japan, and the UK – plus others from countries like Canada, India, Brazil, and Switzerland. It also tracks the M2 money supply from a range of developed and emerging economies.
Notice how GLI “rallied” aggressively at first, when central banks and governments were stimulating the economy during Covid. All that extra financial support can (and did) stoke inflation. And at that point, you can see that central banks tightened their belts – and GLI stalled.
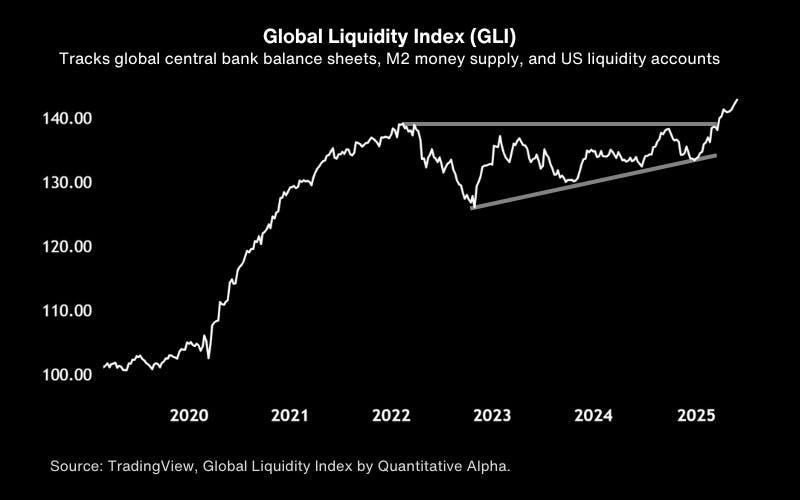
The Global Liquidity Index (GLI) tracks global central bank balance sheets, M2 money supply, and US liquidity accounts. Sources: TradingView, indicator from Quantitative Alpha.
Check out the period from about March 2022 to March 2025. You’ll notice that the GLI consolidated in an ascending-triangle pattern of sorts – with higher lows and similar highs. If you’re into technical analysis, that’s a bullish trading pattern. And now that the GLI’s broken above it, it’s in “blue-sky breakout mode”. And, yes, I know the GLI isn’t an investment (where technical analysis might apply), but the point still stands: global liquidity is surging.
So, what does this mean for your investments?
When there’s more money in the system, it tends to flow into different assets – think stocks, bonds, commodities, bitcoin. In order words, anything with a decent narrative that can be easily bought or sold.
For the most part, we’ve seen this play out since 2020. Just look at bitcoin in the chart below (orange line). While it’s not an exact science, there has been a fairly strong relationship between the GLI (white line) and the OG crypto over the past five years.

Bitcoin tends to (mostly) move with the Global Liquidity Index (GLI). Source: TradingView, indicator from Quantitative Alpha.
As you can see in the next chart, gold (gold line, fittingly) and the S&P 500 index (blue line) have both moved somewhat in line with the GLI, too. For example, both investments had their 2022 bear market lows just as the GLI started to rebound:
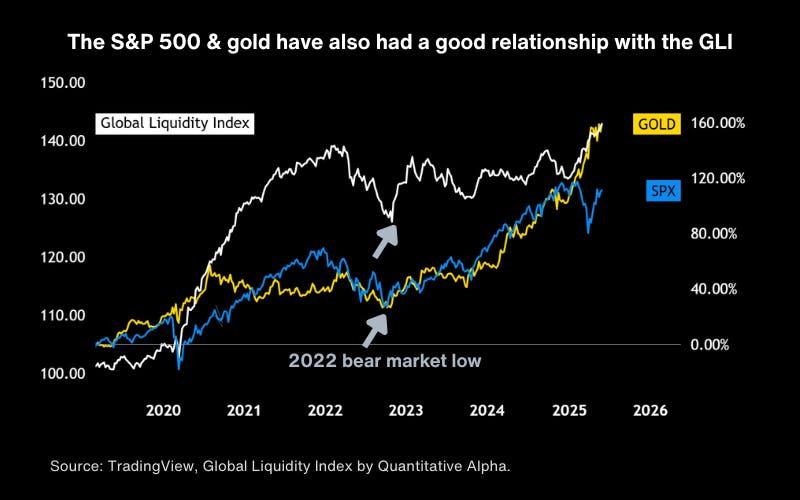
The S&P 500 index and gold have also had a good relationship with GLI. Source: TradingView, indicator from Quantitative Alpha.
So, what’s the opportunity here?
Bitcoin, gold, and stocks have all rallied a lot since 2020. So right now, putting new money in them might feel a tad risky. But there’s one major asset that hasn’t soaked up global liquidity at all over the past few years: long-dated US Treasury bonds.
The blue line in the chart below is the iShares $ Treasury Bond 20+y ETF USD Dist GBP (LSE:IBTL), which invests in US Treasuries that mature in 20 years or more. Unlike most investments, the ETF is down 50% since the Covid liquidity injection. Even this year – as global liquidity pushed higher while interest rates cooled off – TLT hasn’t budged.
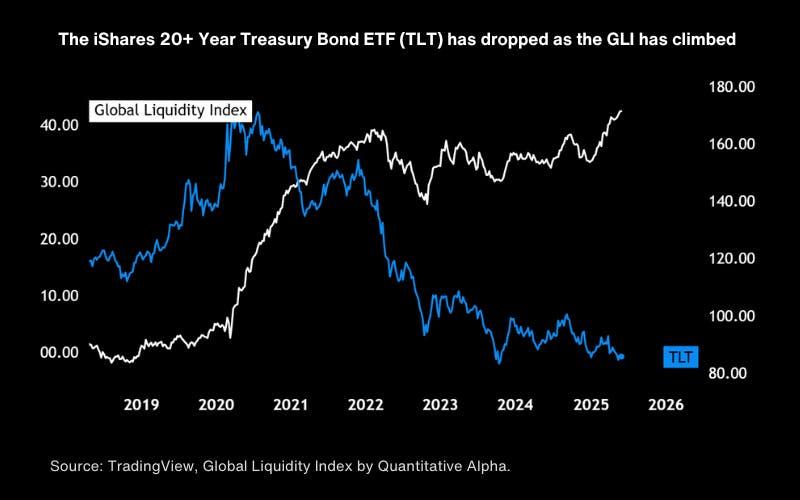
The iShares 20+ Year Treasury Bond ETF (TLT) has dropped as GLI has climbed. Source: TradingView, indicator from Quantitative Alpha.
That’s unusual. “Long duration” bonds (like those in TLT) are supposed to be highly sensitive to interest rate expectations. See, they pay investors fixed yields for many years. So when interest rates fall, those fixed payments become comparatively more valuable. In other words, when interest rates trend lower, the prices of long-dated bonds typically rise (sometimes very fast).
So, why haven’t they? For one, bonds have suffered a brutal bear market, with many investors nervous to tread back in. And for another, they’ve been overshadowed by the hype of AI stocks and the “hard money” narratives of bitcoin and gold. But now that those assets are trading near their highs, and long-dated Treasuries sit near their lows, the set-up is there for a rotation.
Keep in mind that Treasuries are among the most liquid assets in the world. If money starts flowing out of crowded trades (like stocks, gold, and bitcoin), it’ll need to move elsewhere. And TLT, or similar long-duration bond ETFs, might be where it goes next.
After all, with yields near multi-decade highs, Treasuries offer more income than they have in years. And if economic growth slows down and inflation drops (which I think is likely), the case for buying long-duration bonds only strengthens.
Jonathan Hobbs is an analyst at finimize.
ii and finimize are both part of Aberdeen.
finimize is a newsletter, app and community providing investing insights for individual investors.
Aberdeen is a global investment company that helps customers plan, save and invest for their future.
These articles are provided for information purposes only. Occasionally, an opinion about whether to buy or sell a specific investment may be provided by third parties. The content is not intended to be a personal recommendation to buy or sell any financial instrument or product, or to adopt any investment strategy as it is not provided based on an assessment of your investing knowledge and experience, your financial situation or your investment objectives. The value of your investments, and the income derived from them, may go down as well as up. You may not get back all the money that you invest. The investments referred to in this article may not be suitable for all investors, and if in doubt, an investor should seek advice from a qualified investment adviser.
Full performance can be found on the company or index summary page on the interactive investor website. Simply click on the company's or index name highlighted in the article.