The gold-oil ratio is sending a warning sign
When gold buys this much oil, it’s a sign that big changes are under way. Here’s what it all means and how you might profit from it.
2nd May 2025 08:33
by Stéphane Renevier from Finimize
- The gold-to-oil ratio has hit extreme levels. An ounce of gold now buys more than 50 barrels of oil, a signal that has historically flashed only during periods of major financial stress
- It’s a clear sign of the market’s deep macro fears. Investors are wringing their hands about financial system risks, a potential economic slowdown, and rising “monetary inflation”
- There are a couple of ways to play this moment. You could brace for more volatility by leaning into defensive sectors, or position for a snapback by tilting toward oil-related assets, trimming gold exposure, or even setting up a tactical pair trade that goes long oil and short gold.
Markets are flashing a rare – and pretty important – signal right now. One ounce of gold can now buy more than 50 barrels of oil. That’s not some fun market trivia fact – it’s a high that’s been hit only once in the past 45 years. And when it has happened before, it has generally signaled that a major market shift was on the way.
So, here’s what this all means and how you might profit from what’s next.
Why is the ratio so high right now?
Gold, you know, is priced in dollars per ounce, and oil in dollars per barrel – so when you divide one by the other, you can work out how many barrels of oil you’d need to buy with an ounce of gold. When that number climbs higher, it means gold is gaining ground on oil – either because gold’s rallying, or oil’s dropping, or possibly a bit of both.
Right now, it’s a bit-of-both situation: gold’s been powering to record highs as investors rush to hedge against rising macroeconomic risks, and oil has been slipping, thanks to sluggish global demand. That’s led the gold-to-oil ratio to erupt past 50 – a high not seen since the peak pandemic panic.
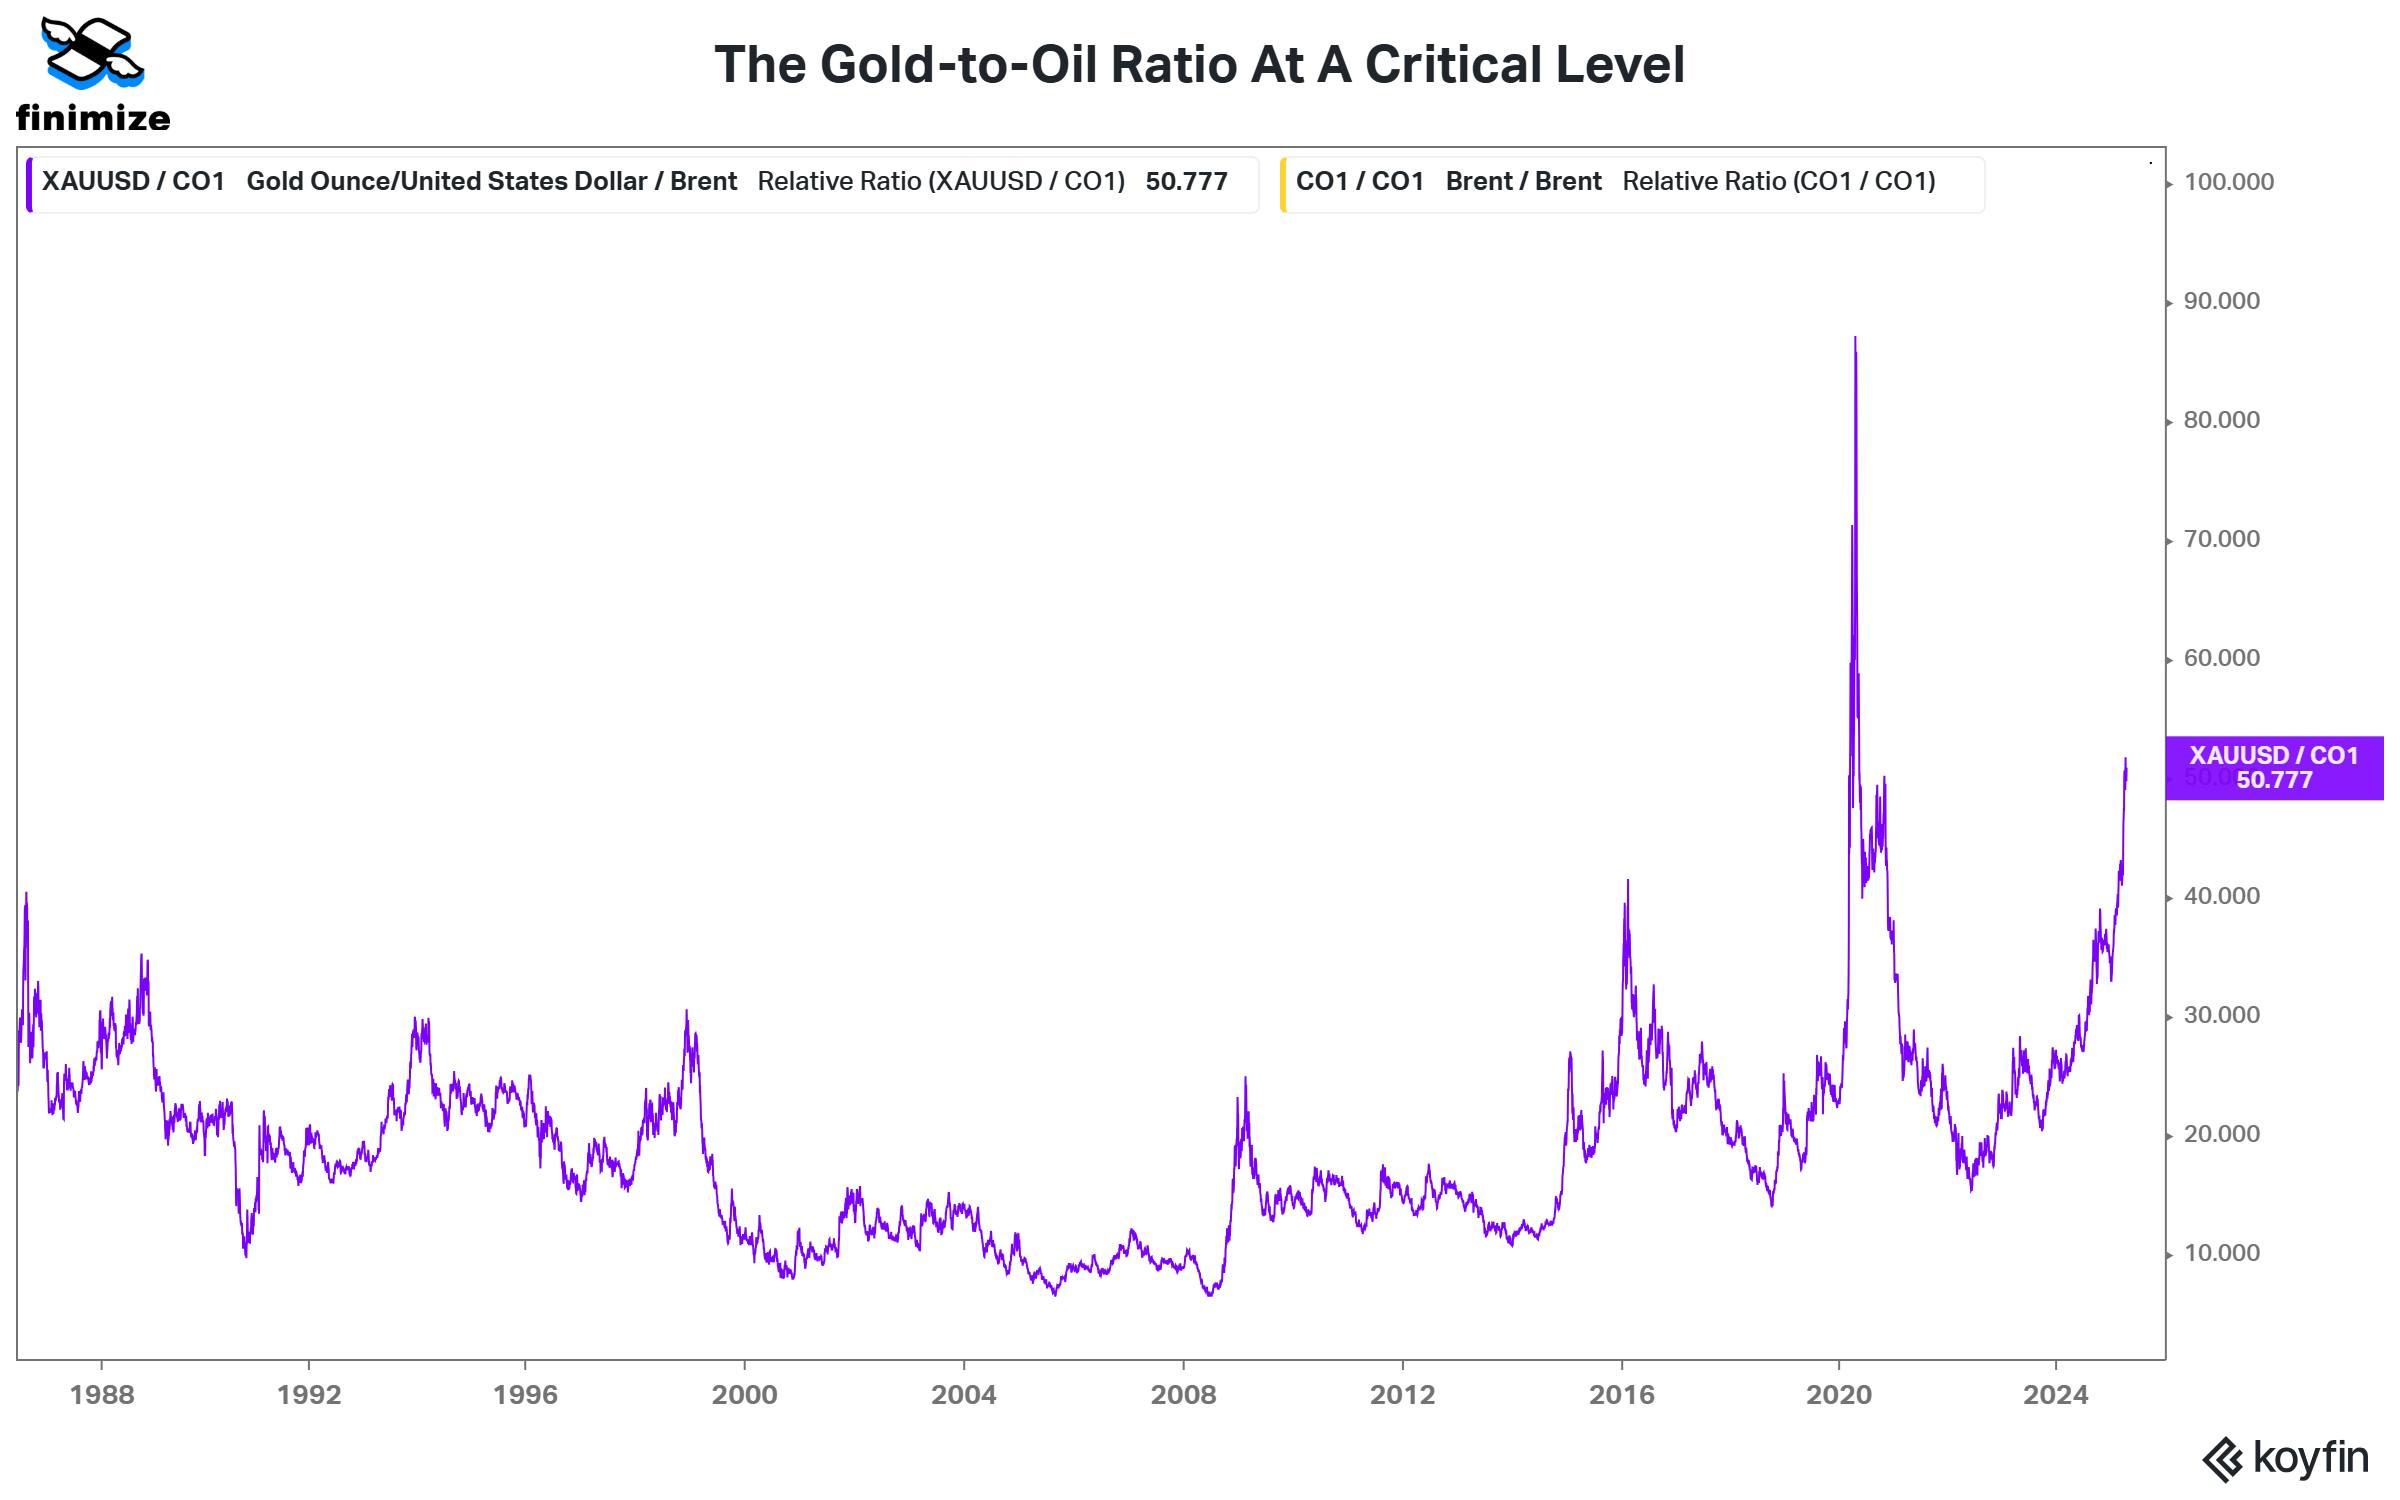
The gold-to-oil ratio hasn’t been this high since the market’s Covid crisis. Sources: Finimize, Koyfin.
What does this say about the market?
The gold-to-oil ratio isn’t just some random, interesting number – it’s a fear gauge. Gold thrives when people are worried about financial meltdowns, runaway inflation, or central banks losing their grip. Oil, on the other hand, tends to do well when the economy is healthy – when industries and commuters are guzzling fuel. So when more investors are buying gold than oil, it tells you that folks are far more focused on financial system risks than economic prosperity.
Makes sense, then, that historically, whenever this ratio has jumped higher, a period of market turmoil has followed. That was true of the 1986 oil glut, the 1998 Asian financial crisis, the 2008 economic meltdown, and the 2020 Covid crisis. That said, there were a few false positives in there too: 2016’s slowdown fears fizzled, and the 2023 mini-banking crisis was quickly contained.
After all, when the ratio’s this stretched, it’s sending some pretty loud messages:
- Macro uncertainty is high, and the risk of financial stress is rising
- The risk of an economic slowdown is high
- Investors are more worried about “monetary inflation” (the kind that boosts gold) than about supply-driven inflation (which usually lifts oil)
What’s the opportunity here?
Now, there’s no hard-and-fast reason why gold and oil prices have to move together – and there’s no rule saying the gold-to-oil ratio has to snap back to more normal levels. But in the real world, when economic forces, shifting sentiment, and one-sided investor positioning push asset prices to one end of the spectrum, sooner or later, those same market forces usually drag them back toward the center. In other words, prices tend to revert to the mean.
That’s what’s happened in the past. Take it from Chris Dover, head of systematic trading at Macro Ops. He spotted this opportunity before I did. He noted – rightly – that after past spikes, the gold-to-oil ratio has typically fallen by 40% or more within a year – either because oil bounces back, gold cools off, or, yep, a bit of both.
So, there are two clear plans of action you can take
First, brace for more volatility. Stocks have pulled back from their highs, sure, but they’re arguably not fully pricing in the macroeconomic risks that the gold-to-oil ratio is flashing. So it’s a good time to lean into defensive sectors and make sure you’re diversified across asset classes and regions. This diversified portfolio and this momentum-based one are a great starting point.
Second, consider positioning yourself for a snap back in the ratio. The latest Commodity Futures Trading Commission data shows that investors have been crowding – really heavily – into long gold positions. In fact, those bets have been sitting in the 88th percentile, while oil longs are scraping the bottom at just the 10th percentile. And with that kind of imbalance, even a tiny shift in mood could spark a major reversal. So you might want to tilt your own asset mix more toward oil-related things like energy stocks or crude oil ETFs, and trim your overall exposure to gold.
If you want to get even more tactical, you could set up a pair trade: go long oil (via futures, oil-related ETFs, or even contracts for differences) and short gold (via the same instruments). That’s a more advanced move – and like any trade, there are no guarantees it’ll work – but mean-reversion setups like this one can be attractive because they have the potential for an outsized, or asymmetric, payoff. After all, when relationships stretch to historic extremes, even a modest snapback to the mean can deliver heftier gains, relative to the potential downside if you cut losses quickly.
If you decide to go down that route, make sure you’re managing your risk properly: set stop-losses 5% or 10% beyond your entry point on both sides (or plan to exit if the ratio pops above 60), and have a clear profit target in mind – ideally aiming for at least two times your potential loss.
Stéphane Renevier is a global markets analyst at finimize.
ii and finimize are both part of Aberdeen.
finimize is a newsletter, app and community providing investing insights for individual investors.
Aberdeen is a global investment company that helps customers plan, save and invest for their future.
These articles are provided for information purposes only. Occasionally, an opinion about whether to buy or sell a specific investment may be provided by third parties. The content is not intended to be a personal recommendation to buy or sell any financial instrument or product, or to adopt any investment strategy as it is not provided based on an assessment of your investing knowledge and experience, your financial situation or your investment objectives. The value of your investments, and the income derived from them, may go down as well as up. You may not get back all the money that you invest. The investments referred to in this article may not be suitable for all investors, and if in doubt, an investor should seek advice from a qualified investment adviser.
Full performance can be found on the company or index summary page on the interactive investor website. Simply click on the company's or index name highlighted in the article.