How China’s tailwinds are turning into headwinds
24th July 2023 09:35
by abrdn Research Institute from Aberdeen
Official data confirmed that GDP growth lost its reopening tailwind. Policymakers will ease but are at risk of doing too little too late.

Key Takeaways
A soft Q2 GDP growth rate confirmed that China’s recovery lost momentum, while revisions to previous data reduce the ‘statistical carry’ and therefore pull down on our annual growth forecast.
Our China Activity Indicator (CAI) declined again in June, consistent with services exhausting their easy gains. In contrast, the industry, real estate & trade sub-index stabilised on net.
The big question is what is going to drive growth forward. Real estate has become a major drag once again and the monthly data series showed activity dropping below November’s lows in June.
The consumption recovery should still have room to run: households have yet to normalise their saving rate, let alone tap the excess savings built up over the pandemic. And if confidence returns, it could still unlock strong activity in H2 and beyond.
But there is little sign of it in the latest data: we estimate retail sales fell 4% on the month, while services have been broadly flat for the past four months and surveys imply that cautious income and employment expectations will keep savings on the side-line.
Weak growth, inflation running well below target and rising youth unemployment increase the chance of policy makers stepping in with a more substantial support package.
But a continued focus on de-risking and self-sufficiency implies stimulus will remain insufficient and piecemeal. As a result, we have trimmed our 2023 GDP forecast to 5.1% (-0.5pp).
China’s reopening rebound has faded
Our China Activity Indicator (CAI) is now sitting slightly below its pre-pandemic average, reflecting the normalisation of services and a large drag from industry, real estate and trade (see Figure 1).
Of course, parsing the extreme volatility introduced by the pandemic and re-opening process raises the risk that nearterm moves are not illustrative of longer lasting malaise.
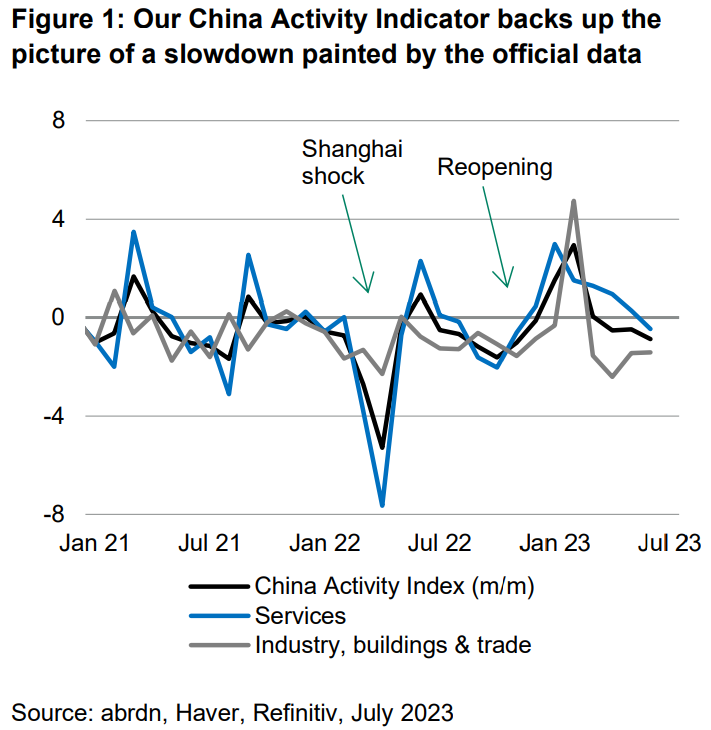
The NBS now estimates that industrial production averaged around 8% month-over-month annualised growth over May and June.
And we also found that industry was helping to counter drags from trade and real estate, lifting this CAI sub-index off its April trough (see Figure 1 grey line).
But big questions remain as to what is going to drive growth for the rest of the year.
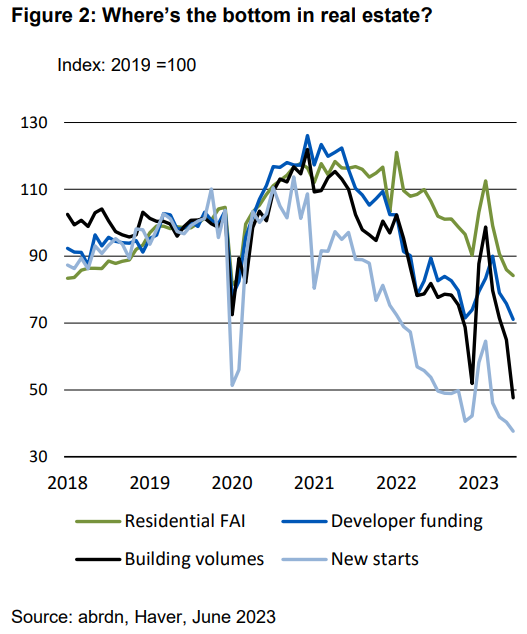
The real estate sector continues to slide, posing risks to other sectors and consumer confidence.
New starts, residential fixed asset investment and building volumes have all fallen below their November lows, while developer funding is now back at its trough (see Figure 2). Moreover, pricing data also points to a weaker market – the proportion of cities reporting falling prices for existing residences is back at over 90%, while price falls have accelerated across tier 1 to 3 cities.
The consumption recovery should still have room to run – the household saving rate only declined by 0.8pp in Q2, and at 31.8% it is still 1 to 1.5 percentage points above its steady state. This implies households are still accruing excess savings which could be drawn down if confidence returns.
On the other hand, the monthly data suggests that services activity has not changed much over the past four months, potentially signalling that there is little appetite for more spending beyond the recovery seen thus far.
Indeed, the PBOC’s Q2 surveys on household income and employment, which can provide an indication on future savings and consumption behaviour, were little changed compared to Q1, and do not clearly point to a savings rate normalisation in the near future, let alone a tapping of excess savings built up over the pandemic (see Figure 3).

Indeed, without some recovery in services momentum and a bottoming of the drag emanating from real estate, the 5% growth target may begin to be increasingly called into question.
In part, that’s due to the revision to the GDP back data which reduces the ‘statistical carry’ for 2023, unwinding most of the carry delivered by the reprofiling that occurred with the Q1 GDP release; hence, even absent changes to growth forecasts for the remainder of the year, the (new) history weighs on the annual growth by around 0.3pp compared to the previous vintage.
Calls for a serious policy easing continue to grow
Weakness in property, combined with the rise in youth unemployment to over 21% should spur further easing from policy makers.
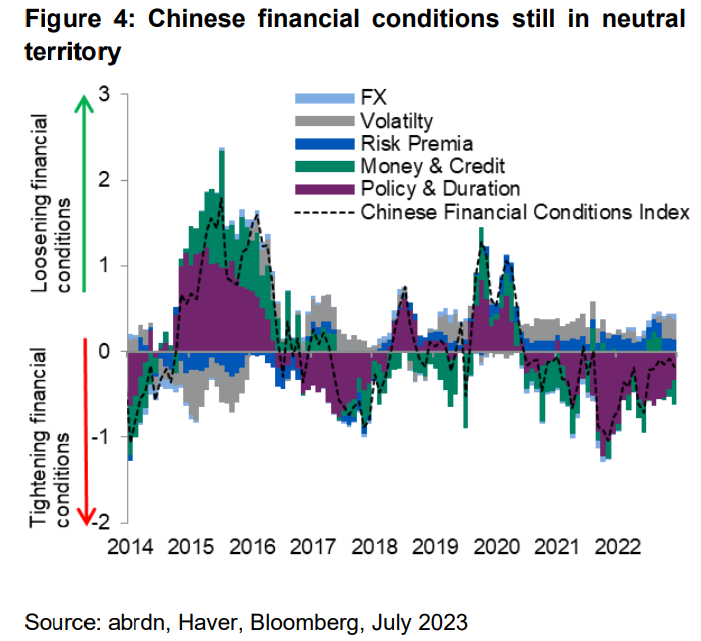
Indeed, despite the 10bps rate cuts enacted in June, financial conditions continue to bounce around neutral, rather than shifting to a more outright supportive position.
Our CFCI is sitting just below neutral as the loosening in Policy & Duration factors on the month was offset by tighter Money & Credit dynamics.
Policy was successful in reducing the drag from Policy & Duration factors in June, but has not been sufficient to move this towards an outright loosening in financial conditions yet.
On the Money & Credit side, the upward surprise in the June credit data helped the credit impulse push higher, but this in turn was more than offset by a growing drag from monetary aggregates.
That said, additional policy easing has become increasingly likely, and we expect that further steps – particularly via local governments – will be announced at July’s Politburo meeting. But a substantial easing, which could unlock household and market confidence, still seems unlikely given the authorities will not want to lose progress made on derisking the economy.
Therefore, while we do expect a broader support package to be announced, the combination of reduced ‘statistical carry’, growing drag from real estate and the fading services rebound means we have trimmed our 2023 GDP forecast to 5.1% (-0.5pp).
Written by Robert Gilhooly, Senior Emerging Markets Research Economist at abrdn, and Research Economist Abigail Watt.
abrdn's Research Institute produces original research at the intersection of economics, policy and markets.
ii is an abrdn business.
abrdn is a global investment company that helps customers plan, save and invest for their future.
These articles are provided for information purposes only. Occasionally, an opinion about whether to buy or sell a specific investment may be provided by third parties. The content is not intended to be a personal recommendation to buy or sell any financial instrument or product, or to adopt any investment strategy as it is not provided based on an assessment of your investing knowledge and experience, your financial situation or your investment objectives. The value of your investments, and the income derived from them, may go down as well as up. You may not get back all the money that you invest. The investments referred to in this article may not be suitable for all investors, and if in doubt, an investor should seek advice from a qualified investment adviser.
Full performance can be found on the company or index summary page on the interactive investor website. Simply click on the company's or index name highlighted in the article.