How long will Lloyds Bank shares be trapped below this downtrend?
Despite coming off the boil in recent sessions, shares are still trading toward the top of their range of the past three years. Independent analyst Alistair Strang has his latest view on the popular high street lender's stock.
22nd April 2024 07:38
by Alistair Strang from Trends and Targets

When we previously reviewed Lloyds Banking Group (LSE:LLOY), we commented on the importance of a 25-year-old downtrend since 2009 and the way by which Lloyds share price was reacting to it.
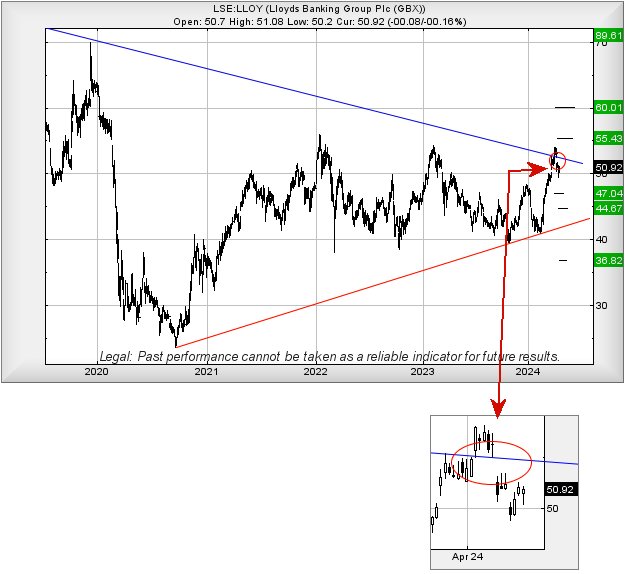
But on 4 and 11 April, something quite fascinating happened, confirming our belief the market regards this long term downtrend as really important. At risk of sounding like a dentist, it’s all to do with unsightly gaps!
- Invest with ii: Open a Stocks & Shares ISA | ISA Investment Ideas | Transfer a Stocks & Shares ISA
Following a period of the share price gyrating against the Blue downtrend, on 4 April the price was manipulated above the trend line at the open of trade and, in normal circumstances this should have signalled a potential for some real price recovery, aside from the salient detail the share price was gapped upward.
Despite its little nudge in the right direction, Lloyds failed to reach our initial target of 55.5p, the rise fading from the 54p level and causing immediate concern. On 11 April, as shown on the zoomed-in bit of the chart below, this share price was gapped down below the trend.
Conventional arguments for this type of price manipulation hints that the share price should reverse to 49p and hopefully rebound. There’s a slight chance the movement on 16 April to 49.4p shall be deemed sufficiently close but, visually, we have our doubts. With the level of effort going on to keep Lloyds share price under control, if “they” intend to play by the rules, we’d normally be quite expectant of a solid 49p making an appearance.
Real danger comes if the price makes it below 49p as reversal to 47p calculates as possible with our secondary, if broken, at 44.7p and hopefully a rebound.

Source: Trends and Targets. Past performance is not a guide to future performance.
On a more positive note, it’s generally the case where the next time a share price heads upward should be the one which triggers some proper movement, a surge in price levels which is generally quite vivid. But for the present, we’re inclined toward caution and above 54.1p should next head to 55.4 with secondary, if beaten, at 60p.
What would really impress us now though is a serious movement, such as the share price being gapped above 54.1p at the open of trade, as this would signal the game is changing and a long-term 89p could become a sensible possibility.
Alas, for now, Lloyds remains trapped below this absurd Blue downtrend which dates back to the market crash of 2009.
Alistair Strang has led high-profile and "top secret" software projects since the late 1970s and won the original John Logie Baird Award for inventors and innovators. After the financial crash, he wanted to know "how it worked" with a view to mimicking existing trading formulas and predicting what was coming next. His results speak for themselves as he continually refines the methodology.
Alistair Strang is a freelance contributor and not a direct employee of Interactive Investor. All correspondence is with Alistair Strang, who for these purposes is deemed a third-party supplier. Buying, selling and investing in shares is not without risk. Market and company movement will affect your performance and you may get back less than you invest. Neither Alistair Strang or Interactive Investor will be responsible for any losses that may be incurred as a result of following a trading idea.
These articles are provided for information purposes only. Occasionally, an opinion about whether to buy or sell a specific investment may be provided by third parties. The content is not intended to be a personal recommendation to buy or sell any financial instrument or product, or to adopt any investment strategy as it is not provided based on an assessment of your investing knowledge and experience, your financial situation or your investment objectives. The value of your investments, and the income derived from them, may go down as well as up. You may not get back all the money that you invest. The investments referred to in this article may not be suitable for all investors, and if in doubt, an investor should seek advice from a qualified investment adviser.
Full performance can be found on the company or index summary page on the interactive investor website. Simply click on the company's or index name highlighted in the article.