ii Private Investor Performance Index: Q1 2022
11th April 2022 09:26
by Jemma Jackson from interactive investor
Sobering quarter where professional fund managers fared no better; longer term positives remain.

- Average ii customer in line with professional managers over six months and one year, and beating them by 6.5 percentage points over two years
- Youngest adult customers in 18-24 age category nurse largest losses in Q1
- Scottish Mortgage no longer the most-held holding among all age categories
- Women outperform men by 1 percentage point over both one and two years
After a torrid time for stock markets in Q1 2022, interactive investor’s Q1 private investor performance index reflects a difficult period for private investors, with the average customer down 3.6% in median terms.
Not even the very wealthy were insulated: while historically customers with £1m plus accounts have performed the best since ii started publishing its index, in Q1 2022, they were down the most by asset band (4.2%).
While important not to dwell too much on one quarter, it is right to reflect on what has been a significant period, firstly from a humanitarian perspective with the devastating invasion of Ukraine, and secondly from a market perspective.
With data now going back 27 months, the index charts interactive investor’s customer performance data, in median average terms*, since the first coronavirus cases emerged in the UK.
Private investors versus fund managers
With the average ii customer down 3.6% in Q1 2022, the scant consolation is that professional fund managers, as measured by the IA Mixed Investment 40-85% shares sector, did no better, and were down 3.7%.
The IA Mixed Investment 40-85% shares sectoris a useful comparison because it reflects amix of equities and bond fund exposure, not to mention cash, that ii customers will have, on average, in their portfolio.
Over six months the average ii customer and professional fund manager were each down 1% and over one year, up 5.4% and 5.3% respectively.
Over the past two years, the average ii customer, in median average terms, beat professional fund managers by a significant 6.5 percentage points. The average ii customer is up 39.7% versus 33.2% for the IA Mixed Investment 40-85% shares sector.
When it comes to the major indices, over two years ii customers are not far behind the FTSE All share and FTSE 100, and they are outperforming UK markets over 27 months. But in more recent times the UK has had a turnaround in fortunes, with the FTSE 100 up 2.9% in Q1.
Richard Wilson, CEO, interactive investor, says: “The horror unfolding in Ukraine has framed what was already a torrid time for markets. So, it’s no surprise to see the first quarter of the year chart the first negative average returns since we first started publishing this index.
“Markets don’t go up in a straight line and this index is a sobering reminder of that. It’s also a reminder of the importance of taking a long-term view, and not putting all your eggs in any one regional basket. The UK’s comeback over the year to date illustrates that very clearly.
“With more questions than answers for many investors in the current uncertain environment, there remain few alternative options beyond the stock market for those who want long term growth and income. The challenge is building a weatherproof, balanced portfolio, and we’re here to help, with our research tools and original content.”
Customer performance in detail compared to indices – to end March 2022
Performance to 31.03.22 | IA Mixed Investment 40-85% Shares | Average ii customer | FTSE World TR GBP | FTSE AllSh TR GBP | FTSE 100 TR GBP | S&P 500 TR (1989) |
3 months | -3.7 | -3.6 | -2.0 | 0.5 | 2.9 | -1.9 |
6 months | -1.0 | -1.0 | 4.8 | 4.7 | 7.8 | 8.5 |
1 year | 5.3 | 5.4 | 14.9 | 13.0 | 16.1 | 21.2 |
2 years | 33.2 | 39.7 | 60.8 | 43.2 | 41.5 | 70.3 |
27 months | 12.9 | 10.8 | 34.8 | 7.2 | 7.8 | 46.3 |
Source: FTSE Index performance, and IA index performance is source: Morningstar. Past performance is no guide to the future.
Average asset split by age
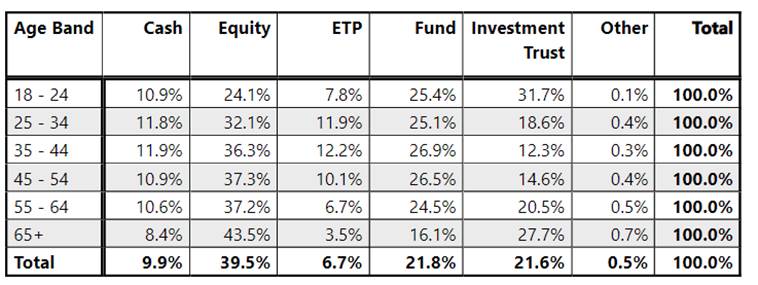
Young customers nurse heaviest losses in Q1 but sitting pretty longer-term
The latest ii performance index also saw some of the shine come off younger, age 18-24 customer portfolios in quarter one, who are down the most, and by an average of 5.5%. The 65+ age group were down the least, nursing losses averaging 3.2%.
Kyle Caldwell, Collectives Specialist, interactive investor, says: “Whatever age you are starting on your investment journey, the path never runs smoothly – but don’t let short term blips throw a well-diversified portfolio off course. Our youngest age cohort may have suffered in the very short term from having the most international exposure, via a much higher than average exposure to investment trusts, which tend to have a high overseas focus. Even so, over the past two years and 27 months respectively, the 18-24 age category are still ii’s highest performing cohort.
“Investment trusts can also gear, which can enhance returns – great when markets are rising, as they hope to long term; but less so when markets suffer a dip. When markets fall gearing leads to greater losses per share- the average investment trust is currently geared by 7%, according to the Association of Investment Companies (AIC).
“Another trend in the first quarter is that anyone with a big holding in Scottish Mortgage (LSE:SMT), will have felt a fair bit of pain over the past several months, and it is interesting that unlike last quarter, it has fallen to second position in the top holdings category amongst 18-24 year olds, with the trust down 28% over 6 months and 23.3% over 3 months to end March 2022**, in share price total return terms.
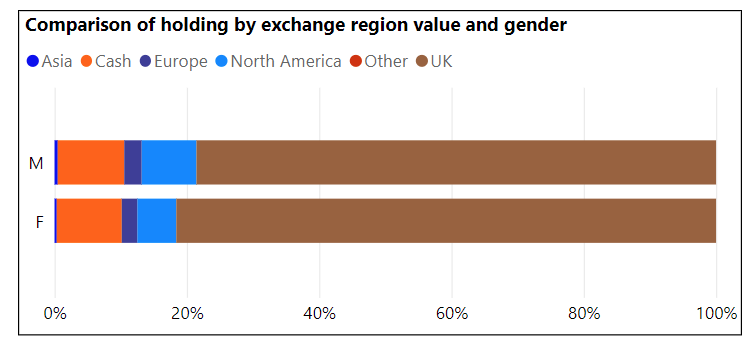
“18-24-year-olds have 32% on average of their portfolios in investment trusts, versus an overall average of 22%. However, the 65+ age group also have higher than average investment trust exposure (28%). The older group may have benefited from having more exposure to the UK. The 65+ category tends to have the highest direct equity exposure (44% of the average portfolio versus an average of 40%), and these direct equity accounts tend to have a high exposure to UK stocks. For example, amongst the average male accounts the average UK exposure is 79% of their direct equity exposure, and that figure rises to 82% on average amongst women.”
Performance to 31 March 2022 | |||||
Age | RETURN_M27 | RETURN_24M | RETURN_12M | RETURN_6M | RETURN_3M |
18 - 24 | 16.1% | 43.2% | 4.1% | -2.5% | -5.5% |
25 - 34 | 14.8% | 40.6% | 4.5% | -1.7% | -4.3% |
35 - 44 | 14.0% | 40.0% | 5.0% | -1.0% | -3.5% |
45 - 54 | 12.3% | 40.1% | 4.7% | -1.4% | -3.8% |
55 - 64 | 10.2% | 39.1% | 4.9% | -1.4% | -3.8% |
65+ | 9.5% | 39.5% | 6.4% | -0.4% | -3.2% |
Past performance is no guide to the future.
Direct equities – regional exposure
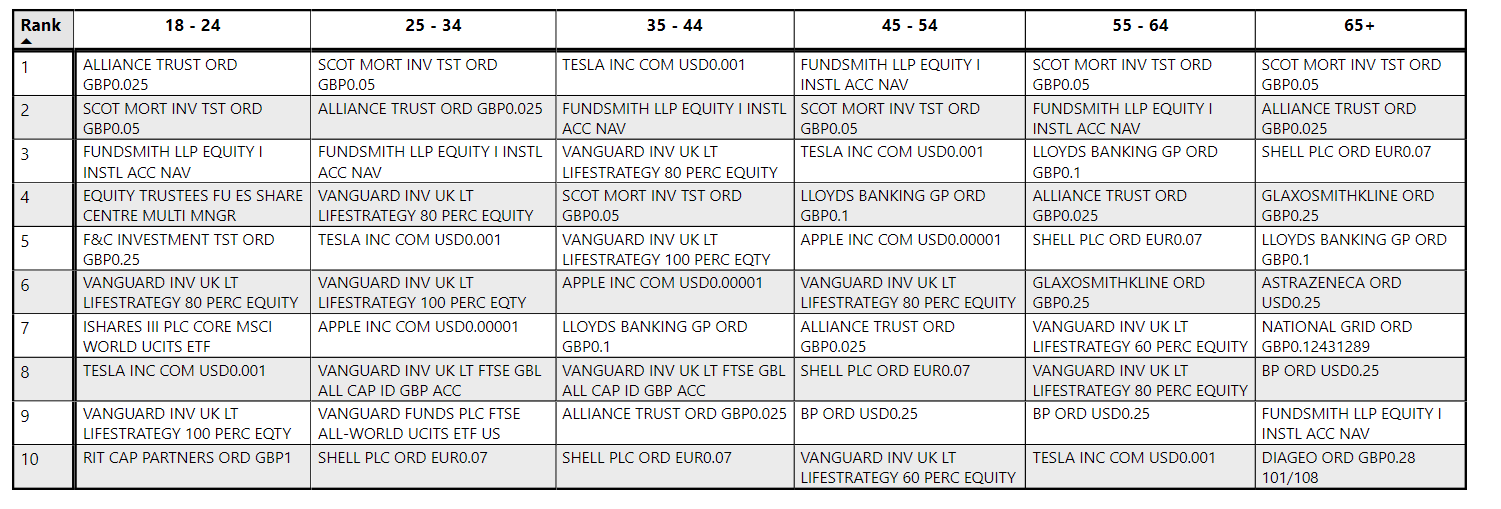
Top holdings as at 31 March 2022
Richard Hunter, Head of Markets, interactive investor, says: “We can see that private investors continue to be attracted by the dual benefits of collectives such as Scottish Mortgage, both in terms of diversification and access to the big tech sectors overseas. The Vanguard Lifestrategy range also dominates the average holdings across all age groups. Apart from the 65+ category, where high yielding FTSE 100 blue chips dominate.”
Returns by asset band
Age | RETURN_M27 | RETURN_24M | RETURN_12M | RETURN_6M | RETURN_3M |
a. £1m+ | 17.0% | 45.3% | 6.3% | -1.0% | -4.2% |
b. £100k - £1m | 13.2% | 41.0% | 5.7% | -1.0% | -3.8% |
c. £50k - £100k | 10.2% | 38.9% | 5.2% | -1.2% | -3.6% |
Past performance is no guide to the future.
Returns by gender
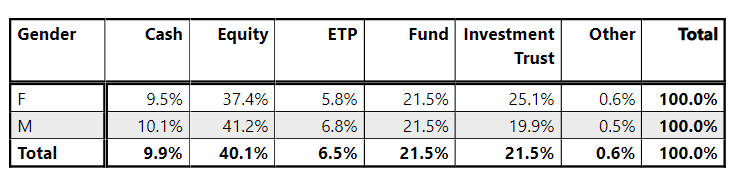
Despite the ongoing market turbulence, the data, once again, shows very little difference between male and female DIY investor performance. That said, women outperformed men by one percentage point over both one year and two years. With performance averaging the mid-single digits over the past twelve months, every percentage point difference counts. Portfolios are broadly similar, with women slightly more inclined to favour investment trusts, and slightly less inclined towards direct equities. But the differences are minimal. Interactive investor now has around 120,000 female customers.
Gender | RETURN_M27 | RETURN_24M | RETURN_12M | RETURN_6M | RETURN_3M |
F | 10.8% | 38.9% | 6.0% | -0.7% | -3.6% |
M | 10.5% | 40.0% | 5.1% | -1.1% | -3.6% |
Past performance is no guide to the future.
Overall portfolio by gender
Regional performance
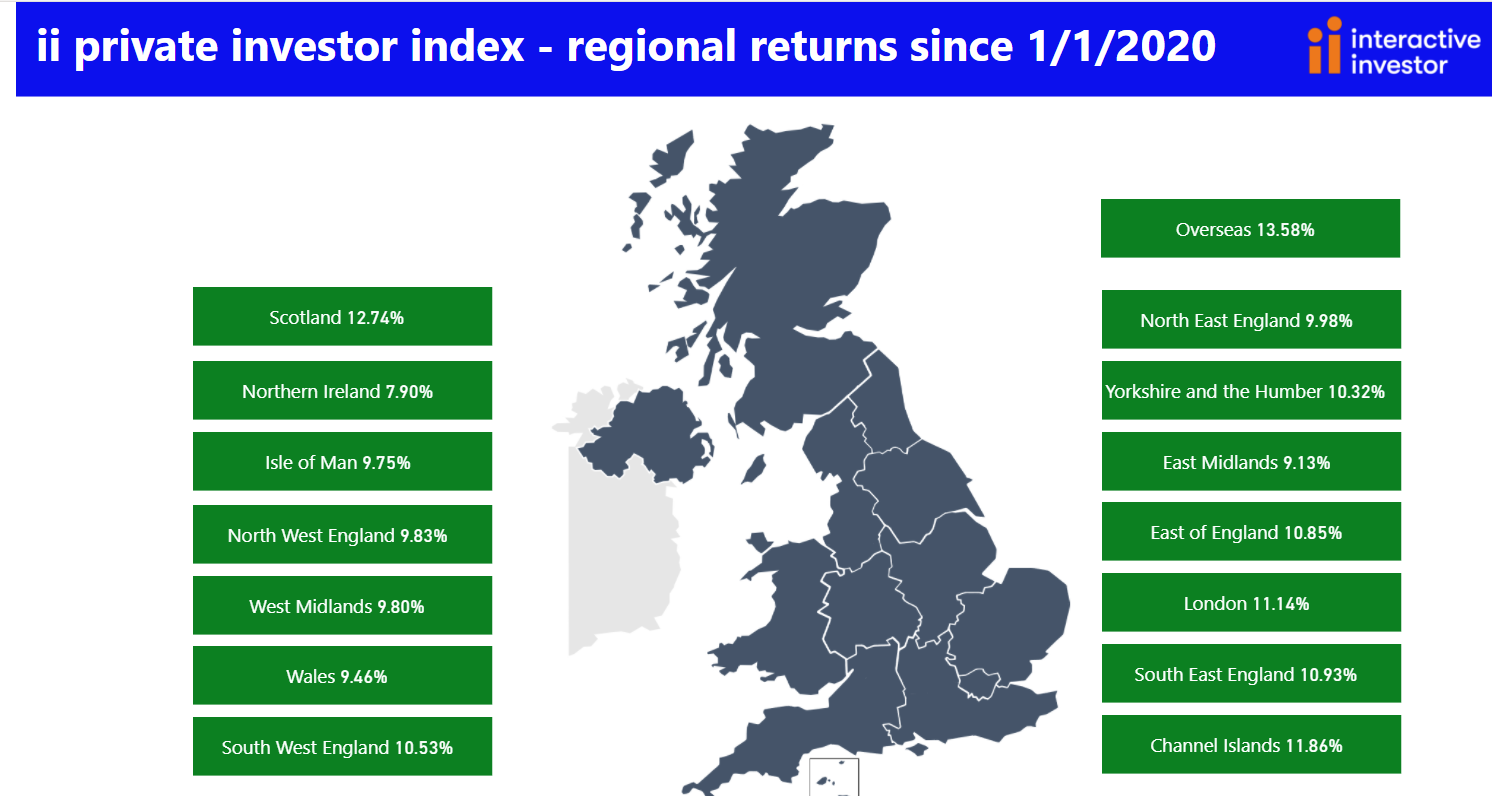
Region | RETURN_M27 | RETURN_24M | RETURN_12M | RETURN_6M | RETURN_3M |
Channel Islands | 11.9% | 43.5% | 5.0% | -1.1% | -3.3% |
East Midlands | 9.1% | 39.0% | 4.9% | -1.6% | -4.1% |
East of England | 10.9% | 39.8% | 5.2% | -1.3% | -3.9% |
Isle of Man | 9.8% | 41.9% | 7.2% | 0.5% | -1.8% |
London | 11.1% | 38.9% | 5.2% | -0.8% | -3.4% |
North East England | 10.0% | 40.1% | 5.7% | -1.0% | -3.7% |
North West England | 9.8% | 39.5% | 5.6% | -1.0% | -3.6% |
Northern Ireland | 7.9% | 37.2% | 4.3% | -1.6% | -3.9% |
Scotland | 12.7% | 42.0% | 6.0% | -1.4% | -3.7% |
South East England | 10.9% | 39.3% | 5.6% | -1.0% | -3.7% |
South West England | 10.5% | 39.7% | 5.8% | -0.9% | -3.6% |
Wales | 9.5% | 39.6% | 5.4% | -0.9% | -3.5% |
West Midlands | 9.8% | 39.7% | 5.1% | -1.3% | -3.8% |
Yorkshire and the Humber | 10.3% | 40.3% | 5.4% | -0.9% | -3.6% |
Past performance is no guide to the future.
Notes to Editors
*ii customer performances quoted are median values to avoid the influence of outlier performance skewing the data.
The performance is calculated using the Time Weighted Rate of Return with returns calculated before each money transaction, then the results compounded over the reporting period. The time-weighted rate of return (TWR) is a measure of the compound rate of growth in a portfolio. It eliminates the distorting effects on growth rates created by inflows and outflows of money.
Then median averages are calculated independently for each group we analysed – so that outlier performances did not skew the results.
Index performance, unless otherwise stated, is ii using Morningstar, total return in GBP, to end December 2021.
Portfolio values under £20,000 were stripped out to keep the sample representative of ii’s core customer base.
**Scottish Mortgage share price total return date taken from AIC website, with data sourced from Morningstar.
These articles are provided for information purposes only. Occasionally, an opinion about whether to buy or sell a specific investment may be provided by third parties. The content is not intended to be a personal recommendation to buy or sell any financial instrument or product, or to adopt any investment strategy as it is not provided based on an assessment of your investing knowledge and experience, your financial situation or your investment objectives. The value of your investments, and the income derived from them, may go down as well as up. You may not get back all the money that you invest. The investments referred to in this article may not be suitable for all investors, and if in doubt, an investor should seek advice from a qualified investment adviser.
Full performance can be found on the company or index summary page on the interactive investor website. Simply click on the company's or index name highlighted in the article.