Kepler Trust report: F&C Investment Trust
F&C Investment Trust is on course for its 49th year of consecutive dividend increases.
29th October 2019 09:21
This content is provided by Kepler Trust Intelligence, an investment trust focused website for private and professional investors. Kepler Trust Intelligence is a third-party supplier and not part of interactive investor. It is provided for information only and does not constitute a personal recommendation.
Material produced by Kepler Trust Intelligence should be considered a marketing communication, and is not independent research.
One of the world’s oldest investment trusts, F&C Investment Trust is on course for its 49th year of consecutive dividend increases.

William Sobczak is an analyst at Kepler Trust Intelligence.
Summary
One of the world’s oldest investment trusts, F&C Investment Trust (LSE:FCIT) is a behemoth of the AIC Global sector, with almost £4 billion in AUM.
The company, over 150 years old, utilises a fund of funds approach, employing BMO’s specialist teams and third-party managers to invest in global equities. According to JPM Cazenove, the company has over 500 holdings across a wide range of geographies and sectors. On top of this, the managers hold both listed and unlisted securities, helping offer investors access to companies and sectors they might otherwise struggle to have such access to.
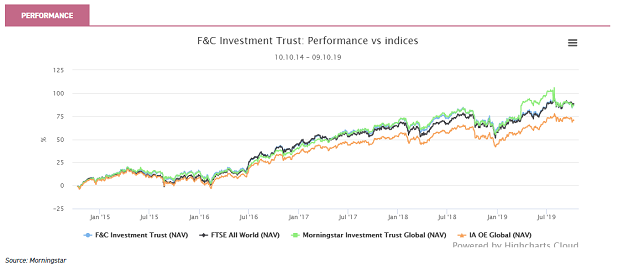
The company is on course for its 49th consecutive year of dividend increases, having paid a dividend every year since launch. Income is not the main focus for the manager, however, and the fund is positioned to deliver long-term growth in capital via an internationally-diversified portfolio. This has been shown since Paul Niven took the helm in 2014, delivering decent NAV total returns. Over the period the company has outperformed both the Global AIC and IA peer groups, although has underperformed the FTSE All-World benchmark.
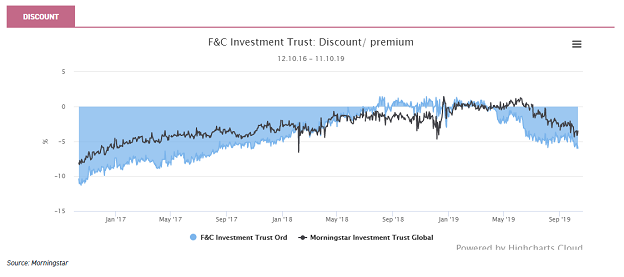
The discount widened out to double digits after the referendum; since then it has narrowed significantly. It currently stands at 5.3%.
Portfolio
The aim of the trust is to secure long-term growth in capital and income through an internationally diversified portfolio. The trust has now been running for over 150 years, a period that has been marked by the continuous evolution of the portfolio. Initially, the constituents of the portfolio were predominantly emerging market bonds with investments spanning Europe, the Middle East, New Zealand, South America and North America.
Over time, the portfolio has expanded to include corporate bonds, equities and private equity. As can be seen below, the FCIT portfolio is made up of inputs from both BMO’s specialist teams and third-party managers, and Paul believes the combination of listed and unlisted securities is a key feature of the trust, which helps both to reduce risk and to limit the volatility of investment returns.
BMO aims for low turnover of the primary managers, though there was a reshuffle a year or so ago as some of the third party private equity fund-of-fund investments were run off. Now, the team is hoping to use the private equity investments as a more focused and opportunistic tool, investing predominantly through BMO's global resources as opposed to through other managers.
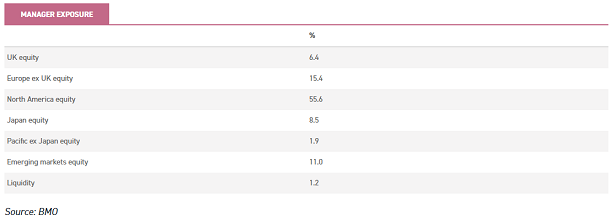
Managers are divided up by geographical exposure, as can be seen below. The largest weighting is towards North American equities, making up 55.6% of NAV. Europe (ex UK) and emerging markets also make up considerable portions of the portfolio with 15.4% and 11% exposure respectively.
Risk management is a particularly prevalent aspect of the portfolio and is achieved via diversification across geographies and sectors. With this said, there are no specific geographic or industry sector exposure limits for the publicly-listed equities. However, no single investment can exceed 10% of the value of the portfolio, and no unlisted security can be greater than 5% of the value of the portfolio. Alongside listed and unlisted securities, the manager is also allowed to use derivatives for income enhancement.
Gearing
The manager is permitted to gear up to 20% of net assets, although gearing typically sits between 7% and 14%. Over the past year, the gearing has been toward the bottom end of the range, averaging 7.5%. The range for the period has been between 9% and 6.5%.
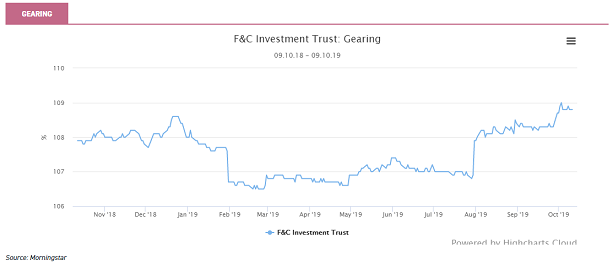
Since 2013 the cost of gearing has substantially reduced, principally due to a change of debenture in 2014 – which had a fixed rate of 11%. This has meant that the weighted average cost of debt has decreased from 7.1% in 2013 to 2.8% last year. This once more reduced in June, when the team decided to take advantage of the low interest environment. It drew down £150m in tranches of maturities ranging between seven to 40 years. The blended rate of this latest issue of debt is 2.2% and it takes the average rate on its borrowings down below 2.5%.
Performance
The trust has delivered decent NAV returns (c. 88.5%) since Paul took over the portfolio in 2014, only marginally underperforming the benchmark FTSE All World (89.1%). The trust has outperformed both the IA and AIC Global peer groups, which have delivered 70.6% and 83.3% respectively.
Looking in greater detail, over the past five years the manager has (with the FTSE World as the calculation benchmark) added an annualised alpha of 0.43, putting the trust in the middle of the AIC peer group for excess return relative to the benchmark. As one might expect with the emphasis on risk management, over the same period the trust had a relatively low standard deviation of 10.16.
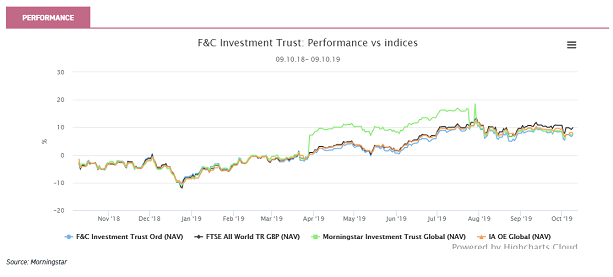
In more recent times, the performance has been varied. Over the past year, to 8 October 2019, the trust has NAV total returns of 6%. This compares to 8.9% from the benchmark and 6.7% and 7.6% from the AIC and IA peer groups respectively.
The trust held up reasonably well during the correction of Q4, outperforming the IA and AIC peer groups. However, despite posting its strongest NAV total returns for over 20 years in H1 of 2019 (14.4%), the trust lagged the peer group. This was primarily due to the recovery in the public equity markets not feeding through to valuations in the private equity market. As such the private equity portfolio lost -1.4%.
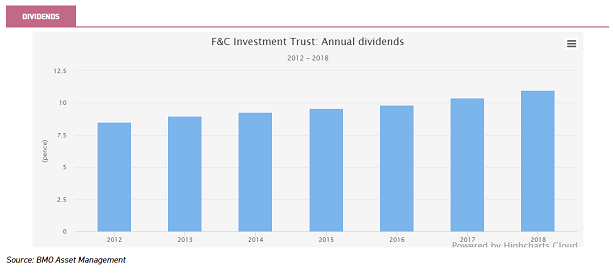
Dividend
FCIT has a paid a dividend every year since 1868. This includes 48 years of consecutive dividend increases, making it the fifth longest record of consecutive dividend increases of all the AIC's ‘dividend heroes’. The 2018 dividend equated to 11p per share, and this was 5.8% higher than the 2017 dividend. Dividend growth over the past decade has been 5.5% and 7.1% over the past 20 years.
In September the board announced the second dividend for 2019, a payment of 2.9p per share, which compares to a 2.7p dividend for the third interim this time last year. It is the intention of the board to deliver another rise in dividends for 2019, which will mark the 49th year of increases in annual dividends.
Management
The trust has an impressive record of long-term managers, and over the past 150-plus years there have only been 11 different managers. This includes only three since 1969.
Currently at the helm is Paul, who has managed the portfolio since July 2014. Paul is supported by the rest of BMO, which offers a wide range of resources across the world. This helps the team to uncover opportunities often overlooked by other companies, as well as access private equity investments other managers might not be able to.
Paul is also a managing director and head of Multi-Asset Solutions – a £30 billion AUM business within BMO. Paul has worked at BMO since 1999, after undertaking a fund management position in Pacific Basin Equities. He has had responsibility for the management of multi-asset mandates within the group since 2002 (including large portfolios for insurance clients) and is chair of the Investment Policy Group.
Discount
The EU referendum in 2016 saw the trust’s discount widen to levels unseen since the financial crisis; however, this has narrowed considerably over the past three years. The start of 2019 saw the trust trade at a premium of around 1%; however, this has since slipped to the current level of 5.3%. This is marginally wider than the rest of the sector, which has a weighted average of 3.5%, and a one-year average of 1.7%.
In terms of discount control, the board previously had a threshold of -10%, but this was reduced to -7.5%, and has now been completely removed. With this said, the board will continue to use buybacks if it sees fit. Over 2019, 603,517 (542,677,195 in issue) shares have been added to treasury.
Charges
The trust has an annual management fee of 0.365% of market cap paid to BMO Global Asset Management and the trust also pays direct fees to its external managers. The ongoing charge of 0.65% is greater than the AIC global arithmetic mean of 0.71% and 0.19% more expensive than the weighted average.
The KID RIY for the trust currently sits at 1.12%, relative to a weighted average in the sector of 1%. With this said, calculation methodologies can vary among companies.
Kepler Partners is a third-party supplier and not part of interactive investor. Neither Kepler Partners or interactive investor will be responsible for any losses that may be incurred as a result of a trading idea.
Full performance can be found on the company or index summary page on the interactive investor website. Simply click on the company's or index name highlighted in the article.
Important Information
Kepler Partners is not authorised to make recommendations to Retail Clients. This report is based on factual information only, and is solely for information purposes only and any views contained in it must not be construed as investment or tax advice or a recommendation to buy, sell or take any action in relation to any investment.
This report has been issued by Kepler Partners LLP solely for information purposes only and the views contained in it must not be construed as investment or tax advice or a recommendation to buy, sell or take any action in relation to any investment. If you are unclear about any of the information on this website or its suitability for you, please contact your financial or tax adviser, or an independent financial or tax adviser before making any investment or financial decisions.
The information provided on this website is not intended for distribution to, or use by, any person or entity in any jurisdiction or country where such distribution or use would be contrary to law or regulation or which would subject Kepler Partners LLP to any registration requirement within such jurisdiction or country. Persons who access this information are required to inform themselves and to comply with any such restrictions. In particular, this website is exclusively for non-US Persons. The information in this website is not for distribution to and does not constitute an offer to sell or the solicitation of any offer to buy any securities in the United States of America to or for the benefit of US Persons.
This is a marketing document, should be considered non-independent research and is subject to the rules in COBS 12.3 relating to such research. It has not been prepared in accordance with legal requirements designed to promote the independence of investment research.
No representation or warranty, express or implied, is given by any person as to the accuracy or completeness of the information and no responsibility or liability is accepted for the accuracy or sufficiency of any of the information, for any errors, omissions or misstatements, negligent or otherwise. Any views and opinions, whilst given in good faith, are subject to change without notice.
This is not an official confirmation of terms and is not to be taken as advice to take any action in relation to any investment mentioned herein. Any prices or quotations contained herein are indicative only.
Kepler Partners LLP (including its partners, employees and representatives) or a connected person may have positions in or options on the securities detailed in this report, and may buy, sell or offer to purchase or sell such securities from time to time, but will at all times be subject to restrictions imposed by the firm's internal rules. A copy of the firm's conflict of interest policy is available on request.
Past performance is not necessarily a guide to the future. The value of investments can fall as well as rise and you may get back less than you invested when you decide to sell your investments. It is strongly recommended that Independent financial advice should be taken before entering into any financial transaction.
PLEASE SEE ALSO OUR TERMS AND CONDITIONS
Kepler Partners LLP is a limited liability partnership registered in England and Wales at 9/10 Savile Row, London W1S 3PF with registered number OC334771.
Kepler Partners LLP is authorised and regulated by the Financial Conduct Authority.
Kepler Partners is a third-party supplier and not part of interactive investor. Neither Kepler Partners or interactive investor will be responsible for any losses that may be incurred as a result of a trading idea.
These articles are provided for information purposes only. Occasionally, an opinion about whether to buy or sell a specific investment may be provided by third parties. The content is not intended to be a personal recommendation to buy or sell any financial instrument or product, or to adopt any investment strategy as it is not provided based on an assessment of your investing knowledge and experience, your financial situation or your investment objectives. The value of your investments, and the income derived from them, may go down as well as up. You may not get back all the money that you invest. The investments referred to in this article may not be suitable for all investors, and if in doubt, an investor should seek advice from a qualified investment adviser.
Full performance can be found on the company or index summary page on the interactive investor website. Simply click on the company's or index name highlighted in the article.
Important Information
Kepler Partners is not authorised to make recommendations to Retail Clients. This report is based on factual information only, and is solely for information purposes only and any views contained in it must not be construed as investment or tax advice or a recommendation to buy, sell or take any action in relation to any investment.
This report has been issued by Kepler Partners LLP solely for information purposes only and the views contained in it must not be construed as investment or tax advice or a recommendation to buy, sell or take any action in relation to any investment. If you are unclear about any of the information on this website or its suitability for you, please contact your financial or tax adviser, or an independent financial or tax adviser before making any investment or financial decisions.
The information provided on this website is not intended for distribution to, or use by, any person or entity in any jurisdiction or country where such distribution or use would be contrary to law or regulation or which would subject Kepler Partners LLP to any registration requirement within such jurisdiction or country. Persons who access this information are required to inform themselves and to comply with any such restrictions. In particular, this website is exclusively for non-US Persons. The information in this website is not for distribution to and does not constitute an offer to sell or the solicitation of any offer to buy any securities in the United States of America to or for the benefit of US Persons.
This is a marketing document, should be considered non-independent research and is subject to the rules in COBS 12.3 relating to such research. It has not been prepared in accordance with legal requirements designed to promote the independence of investment research.
No representation or warranty, express or implied, is given by any person as to the accuracy or completeness of the information and no responsibility or liability is accepted for the accuracy or sufficiency of any of the information, for any errors, omissions or misstatements, negligent or otherwise. Any views and opinions, whilst given in good faith, are subject to change without notice.
This is not an official confirmation of terms and is not to be taken as advice to take any action in relation to any investment mentioned herein. Any prices or quotations contained herein are indicative only.
Kepler Partners LLP (including its partners, employees and representatives) or a connected person may have positions in or options on the securities detailed in this report, and may buy, sell or offer to purchase or sell such securities from time to time, but will at all times be subject to restrictions imposed by the firm's internal rules. A copy of the firm's conflict of interest policy is available on request.
Past performance is not necessarily a guide to the future. The value of investments can fall as well as rise and you may get back less than you invested when you decide to sell your investments. It is strongly recommended that Independent financial advice should be taken before entering into any financial transaction.
PLEASE SEE ALSO OUR TERMS AND CONDITIONS
Kepler Partners LLP is a limited liability partnership registered in England and Wales at 9/10 Savile Row, London W1S 3PF with registered number OC334771.
Kepler Partners LLP is authorised and regulated by the Financial Conduct Authority.
These articles are provided for information purposes only. Occasionally, an opinion about whether to buy or sell a specific investment may be provided by third parties. The content is not intended to be a personal recommendation to buy or sell any financial instrument or product, or to adopt any investment strategy as it is not provided based on an assessment of your investing knowledge and experience, your financial situation or your investment objectives. The value of your investments, and the income derived from them, may go down as well as up. You may not get back all the money that you invest. The investments referred to in this article may not be suitable for all investors, and if in doubt, an investor should seek advice from a qualified investment adviser.
Full performance can be found on the company or index summary page on the interactive investor website. Simply click on the company's or index name highlighted in the article.