Low dividend cover flagged stocks making Covid dividend cuts
Firms identified as dividend traps by HINT had an average dividend cover last year of 1.2 times, almost …
8th July 2020 09:18
by Tom Bailey from interactive investor
Firms identified as dividend traps by HINT had an average dividend cover last year of 1.2 times, almost half the 2.1 times for the wider market.

Strong dividend cover has proven itself to be a reliable indicator of the security of a dividend during the pandemic, according to new research from Henderson International Income Trust (HINT).
As of May 2020, just over one in five (21%) companies in the Janus Henderson Dividend Index had cut their payments for 2020. However, more than two in five (42%) of those previously identified by HINT as potential dividend traps had done so.
Low dividend cover is a big determinant of whether a company is classed as a dividend trap, along with high levels of debt and slow-growing cash flow.
The ratio is calculated by dividing earnings per share by dividend per share. This is considered an important metric in assessing whether a company is in a healthy position to distribute the level of dividends it proposes to.
As a rule of thumb, a low dividend cover score – of around one times or lower – suggests that dividends are vulnerable, as the company is using most, if not all, of its profits to fund its dividends. A figure of two or more times is viewed as comfortable, because it is a sign that a business is not over-distributing.
The firms identified as dividend traps by HINT had an average dividend cover last year of 1.2 times, almost half the 2.1 times for the wider market. Among the big-name dividend traps cutting their payments were Shell, BT, Ford, H&M and Renault.
Dividend cover globally fell to 2.1 times in 2019, down from 2.3 times in 2018. That for 2020 will depend on earnings results and whether more companies cut their payments, but broadly it is expected to fall within the range of 1.9 times to 2.5 times. This, it should be noted, is much better than it was during the depths of the 2008 global financial crisis.
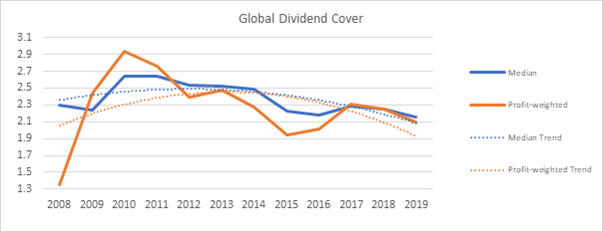
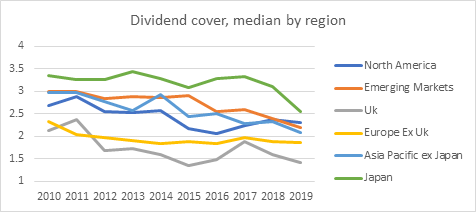
Since 2010, the median level for dividend cover has been downward from its peak of 2.9 times. Over the past decade, dividend cover has trended downward in all regions of the world, including in increasingly dividend-friendly regions such as Japan and Asia.
This article was originally published in our sister magazine Money Observer, which ceased publication in August 2020.
These articles are provided for information purposes only. Occasionally, an opinion about whether to buy or sell a specific investment may be provided by third parties. The content is not intended to be a personal recommendation to buy or sell any financial instrument or product, or to adopt any investment strategy as it is not provided based on an assessment of your investing knowledge and experience, your financial situation or your investment objectives. The value of your investments, and the income derived from them, may go down as well as up. You may not get back all the money that you invest. The investments referred to in this article may not be suitable for all investors, and if in doubt, an investor should seek advice from a qualified investment adviser.
Full performance can be found on the company or index summary page on the interactive investor website. Simply click on the company's or index name highlighted in the article.