This must happen if RBS shares are to stop falling
RBS's share price has opted to disappoint, so our chartist revisits in search for upward potentials.
29th April 2019 09:25
by Alistair Strang from Trends and Targets
RBS's share price has opted to disappoint, so our chartist goes in search of upside potential.
RBS (LSE:RBS)
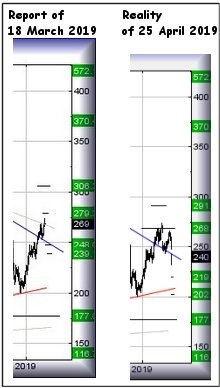
In the month since our last report, RBS (LSE:RBS) share price has opted to disappoint everyone.
It achieved our drop target and opted to break below 239p on the initial surge downward. For reasons given below, from our perspective this is a really bad thing, breaking every optimistic bone in our computer.
Source: Trends and Targets Past performance is not a guide to future performance
As regular readers know, over the years we've habitually given primary and secondary targets, our thinking being if a primary is achieved, after the market has opted to mess around for a while at such a target level, it will eventually move up or down to the secondary target - depending on whether any triggered scenario was for a long or short position.
Eventually, a fairly important penny dropped regarding our primary target positions.
Essentially, if a price breaks the primary on its initial surge, the secondary becomes almost assured. Whereas, if a price opts to spend a few hours teasing a target level but not breaking it, our secondary position is on thin ice.
Quite why it took so many years for this to become apparent escapes us. It certainly explains some of our self congratulatory "Target Met - or near enough" results, these being price movements which fail to achieve their secondary levels but come within a spreads width of target.
Therefore, despite closing Friday at 240p, just above our 239p drop target, the share price of RBS achieved a day low of 232.5p and thus, we should prepare for the worse. The immediate situation suggests ongoing weakness below 232p should bring some reversal toward an initial 219.5p, followed by some sort of bounce.
It will be worth watching for 219.5p being broken as "bottom", the level from where a real bounce can be hoped, calculates at 202.5p.
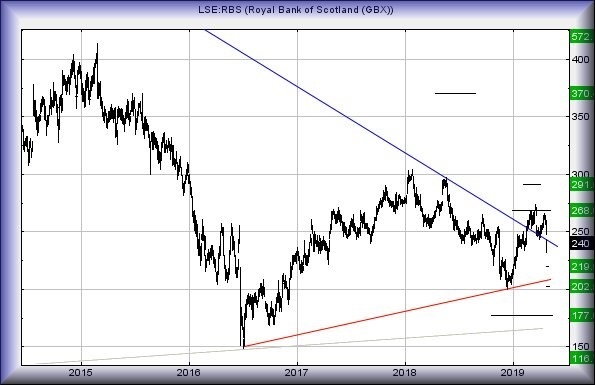
On the chart below, we've a notional trend line, something which dates back 11 years to 2008.
We call it notional, 'cos we've not been convinced it's a trend the market is paying attention to but the opening share price movement on Friday 26th tended confirm the trend was painfully real.
The nice folk who manipulate prices opted to gap RBS rather precisely down below this blue line, meaning RBS share price requires a close above 243p to escape its doom with a bottom at 202.5p (hopefully).
Only with closure above 243p dare we take the attitude of RBS heading to an initial 268p with secondary, if bettered, a longer term 291p.
Source: Trends and Targets Past performance is not a guide to future performance
Alistair Strang has led high-profile and "top secret" software projects since the late 1970s and won the original John Logie Baird Award for inventors and innovators. After the financial crash, he wanted to know "how it worked" with a view to mimicking existing trading formulas and predicting what was coming next. His results speak for themselves as he continually refines the methodology.
Alistair Strang is a freelance contributor and not a direct employee of Interactive Investor. All correspondence is with Alistair Strang, who for these purposes is deemed a third-party supplier. Buying, selling and investing in shares is not without risk. Market and company movement will affect your performance and you may get back less than you invest. Neither Alistair Strang or Interactive Investor will be responsible for any losses that may be incurred as a result of following a trading idea.
These articles are provided for information purposes only. Occasionally, an opinion about whether to buy or sell a specific investment may be provided by third parties. The content is not intended to be a personal recommendation to buy or sell any financial instrument or product, or to adopt any investment strategy as it is not provided based on an assessment of your investing knowledge and experience, your financial situation or your investment objectives. The value of your investments, and the income derived from them, may go down as well as up. You may not get back all the money that you invest. The investments referred to in this article may not be suitable for all investors, and if in doubt, an investor should seek advice from a qualified investment adviser.
Full performance can be found on the company or index summary page on the interactive investor website. Simply click on the company's or index name highlighted in the article.