Is the Nasdaq tech index really about to fall another 10%?
19th November 2018 08:48
by Alistair Strang from Trends and Targets
There's a solidly defined uptrend since 2016 despite some recent wild swings, but chartist Alistair Strang has been investigating the likelihood of further turmoil on the US tech index.

The NASDAQ Big Picture (NDX)
Similar to the S&P 500, the Nasdaq 100 is often referred by a few names depending on which trading platform is used. US Tech 100 seems to be most common at present. From our perspective, it can prove astonishingly reliable, often very fast to move.
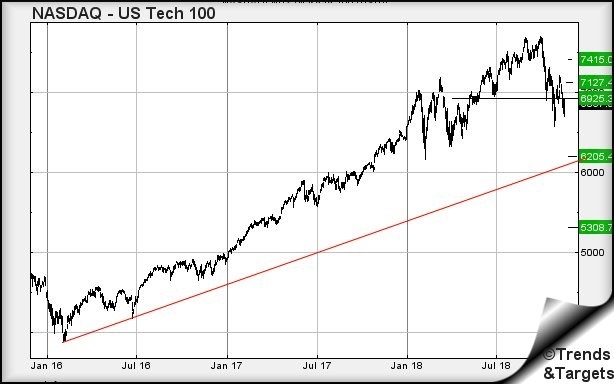
At time of writing, this index is trading at 6,867 points and since our last report, appears to be harbouring an ambition of dropping to 6,200 points.
Thankfully there is a pretty solidly defined uptrend since 2016 which looks perfectly capable of provoking a bounce should such a drop become reality.
A glance back at market lows earlier this year will tend to assure traders there's a natural bottom at around the 6,200 level.
Usually we are pretty confident in giving drop trigger levels but, against this particular index, we're fairly clueless.
The problem has been caused by some of the wild swings during the last few months, meaning it's only a "safe" short if it trades below 6,575 points.
This is pretty useless, given its current price. Even when we zoom in and examine the strength of moves above and below the visual pivot level at 6,925 points, our best guess will be to assume the Nasdaq is about to become critical if it manages below 6,640 points.
Of course, there is no rule that the red line on the chart will be respected. Our secondary, should this index close a session below 6,200 is at 5,300 points!
For now, this market is bouncing above and below 6,925. If any strength is evident near-term, apparently movement now above 6,960 is supposed to generate a surge to 7,127 points.
The visuals imply this will keep the price within its current trading range. Only if above 7,127 dare we speculate on a secondary at 7,415 points.
For now, we suspect 6,200 will eventually make itself known, the market appearing to be awaiting an excuse for a sharp drop.
Source: Trends and Targets Past performance is not a guide to future performance
Alistair Strang has led high-profile and "top secret" software projects since the late 1970s and won the original John Logie Baird Award for inventors and innovators. After the financial crash, he wanted to know "how it worked" with a view to mimicking existing trading formulas and predicting what was coming next. His results speak for themselves as he continually refines the methodology.
Alistair Strang is a freelance contributor and not a direct employee of Interactive Investor. All correspondence is with Alistair Strang, who for these purposes is deemed a third-party supplier. Buying, selling and investing in shares is not without risk. Market and company movement will affect your performance and you may get back less than you invest. Neither Alistair Strang or Interactive Investor will be responsible for any losses that may be incurred as a result of following a trading idea.
These articles are provided for information purposes only. Occasionally, an opinion about whether to buy or sell a specific investment may be provided by third parties. The content is not intended to be a personal recommendation to buy or sell any financial instrument or product, or to adopt any investment strategy as it is not provided based on an assessment of your investing knowledge and experience, your financial situation or your investment objectives. The value of your investments, and the income derived from them, may go down as well as up. You may not get back all the money that you invest. The investments referred to in this article may not be suitable for all investors, and if in doubt, an investor should seek advice from a qualified investment adviser.
Full performance can be found on the company or index summary page on the interactive investor website. Simply click on the company's or index name highlighted in the article.