Oil share analysis: Can Trinity Exploration shares double in value?
18th October 2018 12:57
by Rajan Dhall from interactive investor
Financial markets analyst Rajan Dhall picks out the day's key industry news and runs the numbers to see what this share price might do next.

WTI and Brent crude are currently selling off as the Department of Energy inventory data yesterday produced a surprise build of 6.49 million barrels versus the expected 1.6 million. This was especially a surprise as the API numbers from the day before produced a draw against a previous build.
Since the recent highs seen on 3 October of $76.88 per barrel, we have seen the oil price drop in quite dramatic fashion to hit a low today of around $69.12 per barrel for spot WTI. We are not in a bear trend yet as fundamentals surrounding demand are still robust.
However, on the geopolitical front, tensions with Saudi Arabia are easing as they have offered to help with any investigation in the Khashoggi murder case, although the outcome may not be clear for some time.
Trinity Exploration
Trinity Exploration & Production shares have performed well in recent days following their third-quarter update.
The company, which mainly focuses on Trinidad and Tobago, has maintained production levels, restarted onshore drilling and increased offshore activity, resulting in a strong start to Q4. After a US$20 million fundraise in July, it has fully repaid outstanding debt.
Average production sales volume was 2,734 barrels of oil per day (bopd) in the third quarter, a 9% increase on the same period last year, although it does represent a 3% quarter-on-quarter decline as bad weather and power disruptions kept the Trintes well offline for two months.
In terms of forward guidance, Trinity is upbeat, still confident that 2018 exit production will be in excess of 3,000 bopd, and maintaining that the chickens will come home to roost in Q4 and early in 2019.
Jessica Saadat, an analyst at broker Whitman Howard, still backs the shares to reach 34p, implying that Trinity shares could potentially double in value if all goes to plan.
"Given a strong balance sheet (cash of $17.6 million end Q3), strong oil prices, increasing production, consolidation opportunities and an undemanding valuation, we reiterate our 'buy' recommendation."
Chart analysis
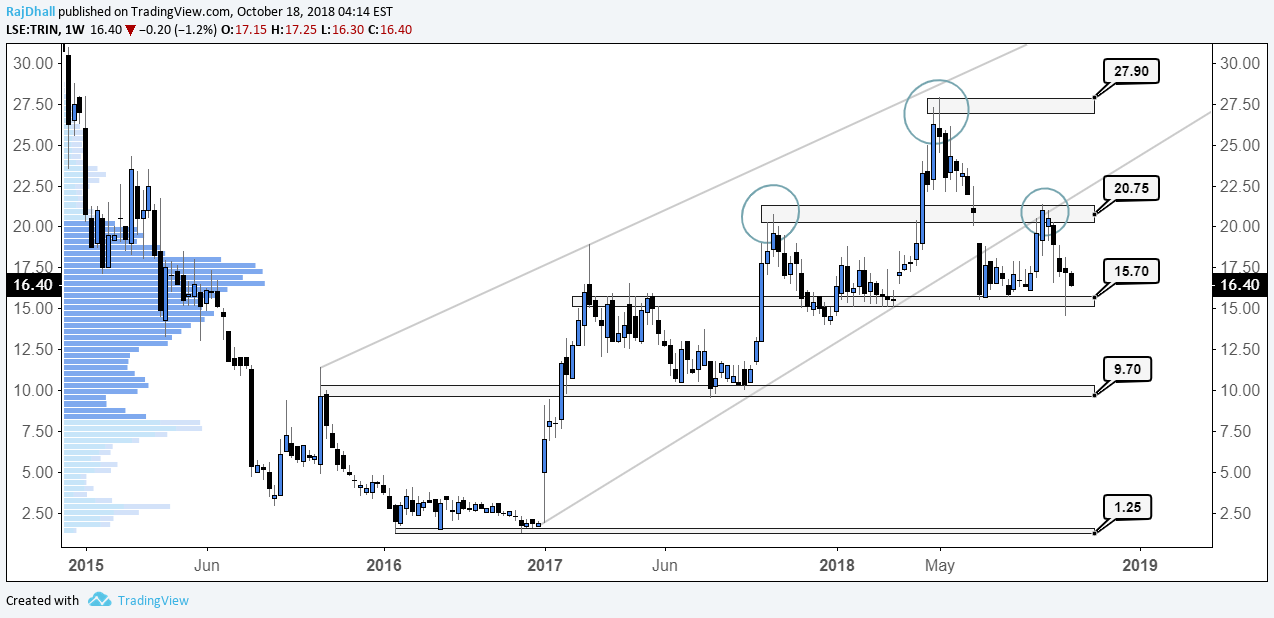
Looking at the weekly chart, it's clear to see we have rejected the 15.7p level and have moved back to the price where most shares have traded (closer to 17.5p). However, the head and shoulders reversal pattern (marked with circles) could indicate downward pressure.
That said, this is not a statistical certainty and the fundamentals certainly back a move higher after the rejection of 15.7p level. Glancing higher up the chart, 20.75p offered some resistance in late 2018, so we could see some stickiness there.
If we do see a clean break, the next target would be the previous high on the chart of 27.9p.

Past performance is not a guide to future performance
Rajan Dhall is a freelance contributor and not a direct employee of interactive investor.
These articles are provided for information purposes only. Occasionally, an opinion about whether to buy or sell a specific investment may be provided by third parties. The content is not intended to be a personal recommendation to buy or sell any financial instrument or product, or to adopt any investment strategy as it is not provided based on an assessment of your investing knowledge and experience, your financial situation or your investment objectives. The value of your investments, and the income derived from them, may go down as well as up. You may not get back all the money that you invest. The investments referred to in this article may not be suitable for all investors, and if in doubt, an investor should seek advice from a qualified investment adviser.
Full performance can be found on the company or index summary page on the interactive investor website. Simply click on the company's or index name highlighted in the article.