Share wars: Thomas Cook vs TUI
13th December 2018 15:16
by Graeme Evans from interactive investor
Just a fortnight after Thomas Cook's profits warning, rival TUI has made public its full-year results. Graeme Evans compares prospects the pair.

With Thomas Cook investors still in a sweat over trading prospects and balance sheet strength, rival TUI showed them another side to the holiday story today.
Comparisons between the two travel giants have inevitably focused on TUI's resilient performance in the face of this summer's Northern Europe heatwave, whereas Thomas Cook announced two profits warnings.
While TUI admits it has been a challenging marketplace, it still managed to grow annual underlying earnings by 11% for the fourth consecutive year of double-digit growth since the company's creation in 2014.
The key difference is that TUI has moved away from the traditional tour operator model and invested in its own product offerings, enabling it to create unique holidays for customers. This is crucial at a time when the traditional tour operator and package holiday market is more competitive than ever.
Online travel agencies have started to combine hotel and flight offerings by providing customers with dynamic packaging. In addition, airline operators are offering holiday accommodation as an add-on to de-risk their own flight capacity, supported by sourcing hotels directly.
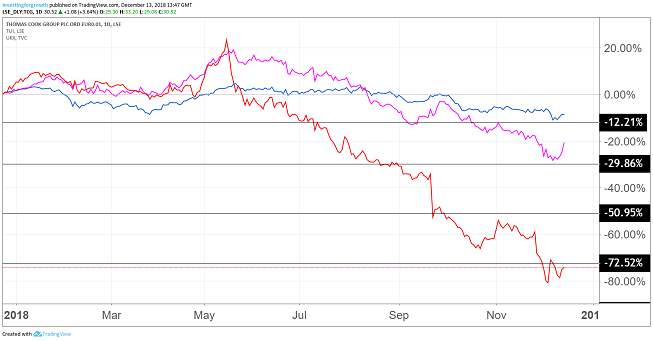
Source: TradingView (TUI, pink; Thomas Cook, red; FTSE 100, blue) (*) Past performance is not a guide to future performance
TUI margins are now much less exposed to changes in trading conditions because it owns around 380 hotels and has its own cruise ship operation. Hapag-Lloyd runs expedition and luxury cruises in the German-speaking market, while Marella Cruises has six liners serving the British market.
In today's results, TUI reported earnings growth of 33% in its Holiday Experiences segment, driven by demand for its portfolio of hotels and clubs, cruises and destination experiences. This side of the business accounted for 71% of underlying earnings in the 2018 financial year.
Like Thomas Cook, TUI's Markets & Airlines division suffered a drop in full-year earnings despite a 4.7% rise in customer volumes. The company expects the challenging market environment facing tour operators to continue, resulting in an impact on the division’s Q1/Q2 2019 results.
It said:
"This reinforces the importance of TUI’s transformation away from the traditional tour operator space, to become an integrated provider of holiday experiences, and which helps to mitigate continued market challenges."
Thomas Cook has been taking steps to grow its own-brand hotels business with the establishment of a hotel investment fund and the opening of 11 new hotels in the last year, including a new concept in Cook's Club.
However, its e-commerce director Phil Gardner admitted yesterday that the company did not implement its strategy quick enough last summer.
He told the Travel Weekly Business Breakfast:
"The best possible margins are on our unique product. It's also where we give our best customer service and receive our best NPS [net promoter scores]. We didn't focus enough on it this summer, so we will next year. I need to do that with trade partners and online."
Thomas Cook shares are now back where they were in 2012, when a mountain of debt left it battling for survival. It cut profits forecasts in September after a difficult latest market caused by the summer heatwave, only to do so again in November with a number of related one-off items.
Worryingly for investors, the net debt of £389 million reported in recent annual results is close to the company's market valuation of £450 million. Shares rose 3% today, helped by a positive reception to the TUI results after the company reiterated its guidance for 10% growth in underlying earnings to 2020.
TUI shares, which have fallen from nearly 1,800p in May, were 6% higher at 1,202p today. In contrast to Thomas Cook, which has suspended its dividend, TUI increased its pay-out by 10.9% to 0.72 euros.
*Horizontal lines on charts represent levels of previous technical support and resistance. Trendlines are marked in red.
These articles are provided for information purposes only. Occasionally, an opinion about whether to buy or sell a specific investment may be provided by third parties. The content is not intended to be a personal recommendation to buy or sell any financial instrument or product, or to adopt any investment strategy as it is not provided based on an assessment of your investing knowledge and experience, your financial situation or your investment objectives. The value of your investments, and the income derived from them, may go down as well as up. You may not get back all the money that you invest. The investments referred to in this article may not be suitable for all investors, and if in doubt, an investor should seek advice from a qualified investment adviser.
Full performance can be found on the company or index summary page on the interactive investor website. Simply click on the company's or index name highlighted in the article.