A stock in one chart: Fenner
5th May 2016 12:42
by Phil Oakley from ii contributor
Former City analyst Phil Oakley believes the fortunes of many companies can be summed up in a single financial chart. This week it's .
Hull-based Fenner has been in business since 1861. It has carved out a niche for itself as a maker of industrial products that help its customers' business to operate more efficiently and safely. The company makes the bulk of its money from industrial conveyor belts used in mining and bespoke engineered products such as high integrity seals for the oil and gas industries.
The company has been going through a very rough time recently as its businesses have seen a sharp fall in demand for their products. The growth of shale gas in the US has seen the US coal industry - a major buyer of Fenner's conveyor belts - take a real hammering and this has led to significant doubts about its future prospects.
At the same time, oil and gas prices have wreaked havoc with the profits of oil and gas companies, which has seen them cut back and buy fewer products from Fenner. It's not really surprising that Fenner's profits have fallen significantly, leading it to slash its dividend.

In times like this it's not unreasonable to ask whether Fenner itself can survive.
One of the key measures of financial health is how easy it is for a company to pay the interest on its debts. Quite often, investors will calculate a company's interest cover by looking at how many times its operating profits can cover the annual interest bill. However, if you really want to check out a company's finances then you need to look at its cash flow instead.
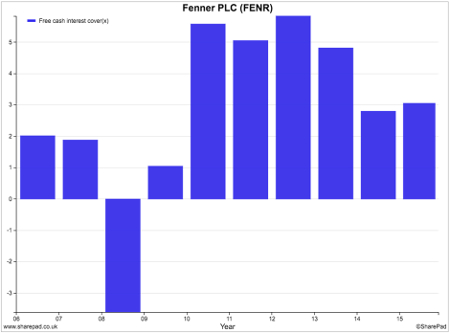
A better alternative might be to calculate a company's free cash flow interest cover. To do this you take a company's cash flow from operations, take away tax paid and money spent on new assets (capital expenditure) and divide it by the cash interest paid on its cash flow statement. This is a much more robust test of a company's finances.
A company has to pay its taxes and keep its assets in reasonable condition but a sniff of a business in difficulties can cause its suppliers to get nervous and ask for quicker payment of their bills. This won't directly reduce the company's profits, but it will decrease the cash flow.
You need to get a good idea if a company can cope - and free cash interest cover arguably does a better job than the more frequently used calculation based on profits.
The chart above shows the difficult predicament that Fenner was in during 2008/2009, when its free cash interest cover went negative. It was in the middle of a heavy investment phase when its trading cash flow took a big hit. It's easy to understand why investors took fright and its share price fell to around 35p.
Whilst it is having a tough time now, its finances are not nearly as worrying as they were back then, especially if profits and cash flows start to recover.
ii view:
There were no real shocks in last week's half-year results. Almost everything was down except the reported loss, which swelled to £23 million. Commodity prices are not tipped to rise much any time soon, either, so volumes remain under pressure. Yes, it looks like the worst may be over, and both restructuring and cost cuts are helping. Confirmation at the full-year results will be well-received, but buying here is only for the brave. A forward price/earnings ratio of 16.9 times, dropping to 14.7 times for 2017, is not cheap.
Read more from Phil Oakley here. Financial charts are a feature of SharePad, the web-based service from ShareScope. Voted UK's Best Investment Software 2015.
This article is for information and discussion purposes only and does not form a recommendation to invest or otherwise. The value of an investment may fall. The investments referred to in this article may not be suitable for all investors, and if in doubt, an investor should seek advice from a qualified investment adviser.