A stock in one chart: National Grid
14th April 2016 12:21
by Phil Oakley from ii contributor
Former City analyst Phil Oakley believes the fortunes of many companies can be summed up in a single financial chart. This week it's .
National Grid is seen by many investors as one of the safest shares to own on the London stock exchange. It has proven to be a very reliable dividend payer and has promised to keep on increasing its payouts to shareholders.
How it has been able to do this is summed up nicely in the chart below. In very simple terms, National Grid's business works a little bit like a savings account, albeit one that is funded with borrowed money rather than savings.
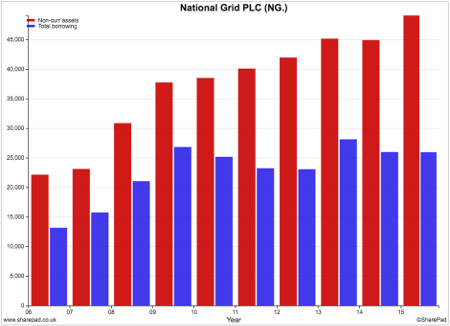
In return for looking after and investing in crucial electricity and gas networks in the UK and USA, National Grid is allowed to earn a rate of interest (profit) on the money that it spends. Every year it invests in new gas and electricity grids, its asset base grows, which usually allows it to earn more money. The red bars on the chart show the extent of how its asset base (fixed or non-current assets) has grown over the last decade.
The blue bars show the borrowed money that has been used to pay for a lot of those assets. As you can see, the gap between the red and the blue bars has been getting bigger. This has led to the gap between NG's profits and interest paid on borrowings getting bigger, which is why it has been able to pay a bigger dividend.
To keep its dividend growing in the future - the company has promised to increase them by the rate of Retail Price Index inflation until 2021 - National Grid has to keep spending money and growing its asset base. It also has to hope that various industry regulators will continue to allow it to earn a high enough rate of return (interest) on those assets. This is by no means certain. Water companies have had to cut their dividends in the past when regulators slashed the returns they were allowed to make on their assets.
The company is confident that its electricity assets in the UK can continue to grow at a rate of 5-7% per year. However, it is looking to sell some of its UK gas assets because the value of these cannot grow much, going forward.
The short-term outlook for UK electricity is also a little bit uncertain. Subsidies to renewable energy (wind and solar) have been cut, making them less attractive to investors, old power stations are closing and big projects such as the Hinkley Point nuclear power station have been delayed. All this means that NG will connect fewer new electricity sources to the national grid than it thought it would a few years ago.
Longer-term, old grid assets will need replacing, whilst the UK will need new sources of electricity as more old power stations close. The company and its shareholders will hope that this means that assets and the income from them can keep on growing.
Disclosure: Phil Oakley owns shares in National Grid.
ii view:
National Grid has ranked among the most popular equity investments for six years. Investors recently paid over £10 a share for the first time since it floated in 1995, equal to a price/earnings (PE) ratio of about 16 times. That's not obviously expensive, and the dividend yield of 4.5% remains tempting, but regulatory risk and an inevitable increase in interest rates at some point begin to damage the case for buying more here, certainly before full-year results on 19 May.
Read more from Phil Oakley here. Financial charts are a feature of SharePad, the web-based service from ShareScope. Voted UK's Best Investment Software 2015.
This article is for information and discussion purposes only and does not form a recommendation to invest or otherwise. The value of an investment may fall. The investments referred to in this article may not be suitable for all investors, and if in doubt, an investor should seek advice from a qualified investment adviser.