Stockmarket's looking like 1999 all over again
12th December 2016 10:59
by Lance Roberts from ii contributor
It's beginning to look a lot like…1999!
It is interesting to watch the excitement build around the market once again as we head into the New Year. There is an optimism rising that the "new bull market" has finally arrived and we are set to start an unprecedented advance as the calendar turns.
And, as I showed last weekend, investor confidence is extremely high levels as well.
But here is the latest from the National Association of Active Investment Managers (NAAIM), which shows managers at a net 101% exposure.

See, it's all good…for now.
If this market rally seems eerily familiar, it's because it is. If fact, the backdrop of the rally reminds me much of what was happening in 1999.
1999
• Fed was hiking rates as worries about inflationary pressures were present.
• Economic growth was improving
• Interest and inflation were rising
• Earnings were rising through the use of "new metrics," share buybacks and a mergers and acquisitions (M&A) spree (who can forget the market greats of Enron, Worldcom & Global Crossing?)
• Stockmarket was beginning to go parabolic as exuberance exploded in a "can't lose market".
If you were around then, you will remember. The charts below show a comparison of GDP, inflation, interest rates (10-year) and the S&P 500 between 1998-2002 (dashed lines) and 2014-Present (solid lines). The data is nominal and quarterly.
While inflation rates and GDP growth are substantially weaker than in 1998, the recent turn higher is similar to what we saw during that previous period.
Notice in 2000, there was a spike higher in GDP which got the bulls all excited just before the recession took hold.
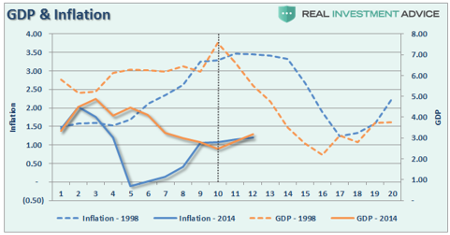
The same is true for interest rates, which rose about 1.5% between 1998 and 2000. Rates then resumed their long-term downtrend in conjunction with the onset of a recession.
Of course, as rates, inflation, and economic growth were rising by small amounts, investors pushed asset prices higher, expecting the longest economic growth cycle on record to continue for another decade.
It didn't.
The next chart (below) gives a better comparison. I have combined interest rates, GDP, and inflation into a single "economic index" for both the 5-year period beginning in 1998 and 2014 to present. I then recalibrated the 2014 index and market to 1998 levels.
This is where it gets interesting. If you look at the chart you would quickly make the argument that we have 8-10 quarters ahead of us before a problem occurs. However, because we are running at half the previous rate, there is substantially less room to fall before a recession sets in.
In other words, in 1998, the economy had to decline from a 7.5% growth rate to hit recessionary levels.
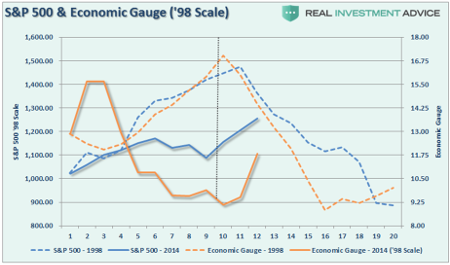
Considering we are at 2% today, the time to recession will be considerably shorter – like 2-4 quarters kind of short.
For the sceptics, below is the actual data graphed from 1997-2014. Stocks entered the melt-up phase as the "Bullish Mantra" changed from:
"Lower rates and lower inflation are good for stocks"
to:
"Higher rates and higher inflation are good for stocks".
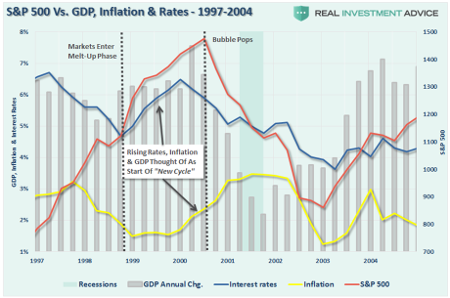
The mantra of higher inflation and higher rates is good for stocks has once again returned as stocks enter their "melt-up" phase of the advance. As shown above, it wasn't the case then and it likely won't be the case now.
While there is much hope the new president, and his newly minted cabinet, will "Make America Great Again", there can be a huge difference between expectations and reality.
And, like in 1999, there is just the simple realization that eventually excesses will mean-revert.
This article is for information and discussion purposes only and does not form a recommendation to invest or otherwise. The value of an investment may fall. The investments referred to in this article may not be suitable for all investors, and if in doubt, an investor should seek advice from a qualified investment adviser.
Lance Roberts is a Chief Portfolio Strategist/Economist for Clarity Financial. He is also the host of "The Lance Roberts Show" and Chief Editor of the "Real Investment Advice" website and author of The "Real Investment Daily" blog and the "Real Investment Report". Follow Lance on Facebook, Twitter and Linked-In.