Stocks are climbing a ‘wall of worry’ and it sounds more doomy than it is
26th May 2023 13:47
by Paul Allison from Finimize
Stock markets climb the “wall of worry” and fall down the “slope of hope”, or so the saying goes. The way I see it, this market is slanted upward. Here are three indicators that make the case.
Stock markets climb a wall of worry and fall down the slope of hope. Today’s market has the hallmarks of a wall of worry.
Bank of America points to three technical indicators as proof that investors are biting their nails, even as stocks continue to grind higher.
That may bode well for stocks, despite the laundry list of concerns out there. Mind you, there’s never been a time in the market without worry.
Stock markets climb the “wall of worry” and fall down the “slope of hope”, or so the saying goes. Right now, it might seem entirely unclear which way the ground is tilted – whether we’re on that wall of worry, ascending despite investor fears, or on that slope of hope, in a general downtrend interrupted by optimism-driven rallies. But, the way I see it, this market is slanted upward, and the analysts at investment house Bank of America seem to agree. Here are three indicators that make the case...
1. The VIX
The VIX, the volatility index popularly known as the market’s “fear index”, measures sentiment using 30-day index option prices. Nervous investors use index options to protect their portfolios against a pending stock market fall. Rising options prices – and thereby a rising VIX – are a sign investors are snapping up those insurance policies because they’re worried about what’s around the corner.
Now, when the VIX is low and falling, it’s usually a sign of calm and it often coincides with rising stock prices. That, in and of itself, can be a warning sign: it’s what happens when investors have become complacent and start to ignore downside risks.
But when you combine a longer-term volatility index – like the 90-day VIX index – with the usual 30-day VIX, and compare the performance of the two, the predictive power increases. It goes like this: when the 90-day VIX is outperforming the 30-day VIX, it’s because the shorter-dated VIX (30-day) is falling faster – a sign that investors aren’t nervous about an immediate stock pull-back. When that trend reverses, and the 30-day VIX starts to outperform the 90-day VIX, it’s because investors are buying up shorter-term options to hedge their portfolios against an immediate risk. And that can spell trouble for the S&P 500.
And that’s exactly what happened. Take a look at the lower graph in the chart. It shows that the 90-day VIX was outperforming from roughly mid-March until mid-April. But then it looked like the trend was going to reverse. Now compare that with the top graph, which shows the S&P 500 had been moving almost in lockstep and appeared to reverse right around the time the 30-day VIX started to outperform.
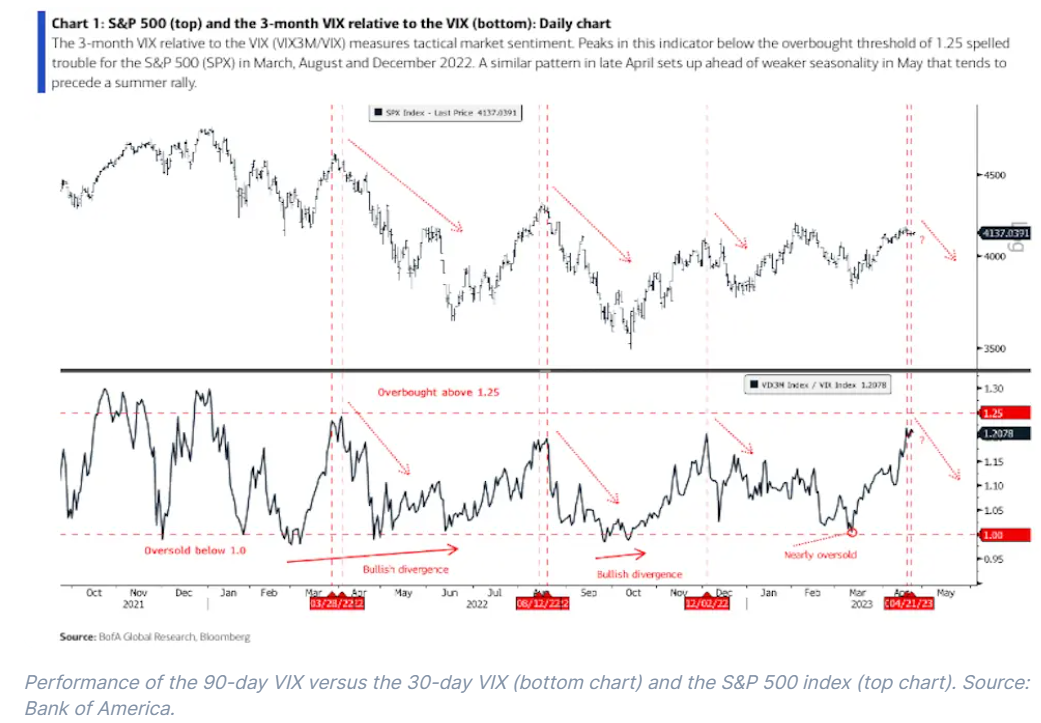
The VIX indicators, then, suggest the S&P 500 was due for a correction. But that didn’t happen, and the S&P 500 managed to continue to eke out gains. What’s more, it climbed despite all the negative headlines – like recession risk and US government default risk – and the fact that May’s usually a bad month for stock prices.
2. Money manager surveys
Bank of America’s global fund manager survey takes the pulse of professional investors every month and presents their opinions on markets and economies. The latest installment showed that the pros are jittery: their safe-haven bond allocations are bigger than they’ve been in 14 years. They’re also holding more cash. But even though professional investors are biting their nails, stock markets have continued to trend higher. And it’s not just in the US, either: the German Dax index recently hit an all-time high, as did the UK’s FTSE 100, and Japan’s Topix index is at 33-year highs. So up and up we climb…
3. Chart patterns
Head and shoulder patterns are one of the most well-known – and reliable – technical indicators for stock prices. When a head-and-shoulders top pattern forms, it’s often a signal that a bullish market is about to enter a new, worryingly bearish phase.
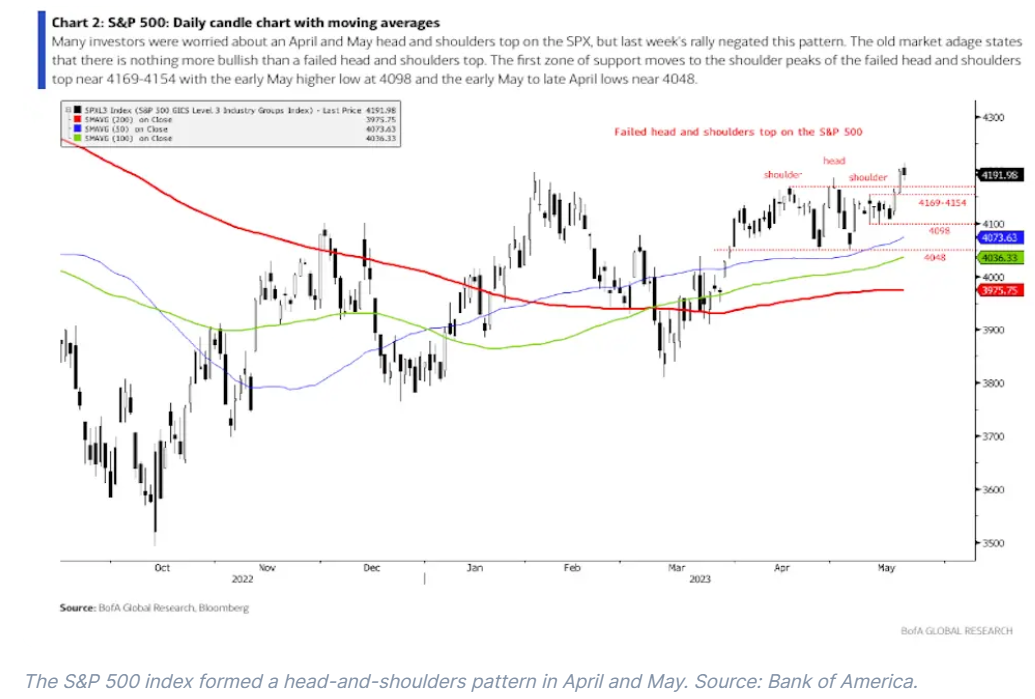
During April and May, a head-and-shoulders pattern developed (think of it literally looking like a head sticking out above two equal-height shoulders). And when that happens during a bullish market phase – markets have been trending higher since October last year, after all – it’s normally a bad sign. But, this time, markets have moved higher, rather than lower. Ask any OG technical analyst and they’ll tell you: “there’s nothing more bullish than a failed head-and-shoulders top”.
What’s the takeaway, then?
You’ll never experience a period when there’s nothing to worry about in the market. They simply don’t exist. And bad things will likely always make headlines far more than good things will. And, sure, that can make those walls of worry seem insurmountable, but in investing, there’ll always be risks: if you wait for them to get cleared up, you can bet you’ll have missed the boat.
So, instead of being panicked by all the bad news, take a step back and remember that stocks never climb a worry-free wall. The headlines might bode ill, but for long-term investors, they often turn out to be just noise. Remember that in the end, things tend to turn out OK, so stay invested, and keep focused on the long term.
Paul Allison is a senior analyst at finimize
ii and finimize are both part of abrdn.
finimize is a newsletter, app and community providing investing insights for individual investors.
abrdn is a global investment company that helps customers plan, save and invest for their future.
These articles are provided for information purposes only. Occasionally, an opinion about whether to buy or sell a specific investment may be provided by third parties. The content is not intended to be a personal recommendation to buy or sell any financial instrument or product, or to adopt any investment strategy as it is not provided based on an assessment of your investing knowledge and experience, your financial situation or your investment objectives. The value of your investments, and the income derived from them, may go down as well as up. You may not get back all the money that you invest. The investments referred to in this article may not be suitable for all investors, and if in doubt, an investor should seek advice from a qualified investment adviser.
Full performance can be found on the company or index summary page on the interactive investor website. Simply click on the company's or index name highlighted in the article.